
We're now 8 rounds into the season and I'm guessing that some Investors might be curious about which teams and which Funds are responsible for their gains and losses.
The first table looks at the situation by team and by Fund.
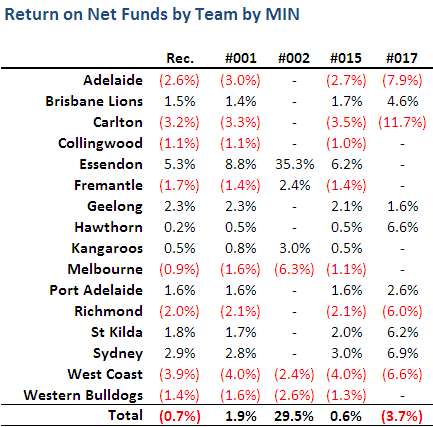
The entries in the table reflect the profit or loss attributable to the team whose name appears in the left-hand column. So, for example, Adelaide has been responsible for losing 2.6% of the Funds held by those with the Recommended portfolio, 3% of the Funds held by MIN#001, none of the Funds held by MIN#002, 2.7% of the Funds held by MIN#015, and 7.9% of the Funds held by MIN#017.
Looking down the first column we find that the Eagles have been the source of largest losses for those with the Recommended Portfolio, thereafter followed by the Blues, the Crows and the Tigers. Essendon have provided the largest profits followed by Sydney, Geelong and St Kilda. Teams current in the top 8 have contributed to gains of 8.2% and those outside the top 8 have contributed to losses of 8.9%.
Next we turn to a Fund-by-Fund view.

New Heritage's net loss of 3.7% is entirely the fault of the Crows, the Blues, the Tigers and the Eagles, whose losses have been offset to a less than full extent by the Lions, the Hawks, the Saints and the Swans.
Prudence has been hurt by the Blues, Tigers and Eagles, and bolstered by the Lions, the Saints and the Swans.
The Hope Fund's profit is almost solely down to the Dons, with smaller contributions coming from Freo and the Roos. The Dees, the Eagles and the Dogs have been the only value-destroyers.
Chi-Squared's had little joy. Freo and the Eagles have both inflicted losses, and the Lions have contributed the only, paltry profit.
Line Redux, after starting the season well, has now dropped into loss, largely due to the Crows, the Pies, the Hawks and the Dogs. Profit has come from the Cats, Port and the Swans.
So, now you know who to blame ...
No comments:
Post a Comment