Monday, March 30, 2009

Pointless v St Kilda

The Swans' 2nd and 3rd quarter performances last Saturday should not go unremarked.

In the 3rd quarter they failed to register a point, which is a phenomenon that's occurred in only 1.2% of all quarters ever played and in just 0.3% of quarters played since and including the 1980 season. Indeed, so rare is it that only one occurrence has been recorded in each of the last two seasons.

Sunday, March 29, 2009

Round 1: The Washup

All things considered, I'd take those Round 1 results every time.

For Investors, the finest of traditions has been continued and many of them are now a little more wealthy than they were on Thursday, thanks entirely to a stirring comeback from the Hawks that, while ultimately unsuccessful in landing the two points, was good enough to prevent the Cats from covering the spread.

BKB, CTL and most of the heuristic tipsters bagged 6 tips, Chi and ELO bagged 4 (Chi having been 0 from 3 and down at half-time in the next two), and only Home Sweet Home scored worse than chance, recording just 3 from 8.

So, onto Round 2 ...

Wednesday, March 25, 2009

Gone in Nine Hundred Seconds

So much fanfare for so little action.

Just one bet this weekend: Hawthorn +17.5 against Geelong at $1.90.

(You can download the details via the Wagers, Tips & Results link at right.)

We would - indeed should - also have been on the Lions at -23.5 against West Coast except that the value in the bet disappeared with extraordinary speed earlier today. The Line market went up at 11:49am and then, in the time during which I ran the models and cranked out our bets, which took about 15 minutes, the Line market for the Lions/Eagles game went from $1.90/$1.90 to $1.80/$2.00. Clearly, a bunch of savvy punters saw the opportunity and took it, depriving us of our own opportunity to share in the imbalance. A move of 10c in the first fifteen minutes of a Line market suggests that someone got something terribly wrong.

Had the starts in other games been a little less generous we'd have also been on the Pies and Port (which sounds a little like a desperately unhealthy meal), but 21.5 and 22.5 points start respectively just don't quite offer enough value to justify a nibble.

On the tipping front Richmond, the Lions and St Kilda enjoy unanimous support. Bear in mind that, amongst the heuristic tipsters, all but Home Sweet Home follow Consult the Ladder in Round 1, so the near unanimity amongst them is somewhat artificial.

Chi's Game of the Round is tomorrow night's Richmond v Carlton game in which he's plumped for the Tigers by just 1 point. ELO's Game of the Round is the Hawks v Cats matchup for which it's also predicting a 1 point result. Both are tipping something of a blowout in the Lions/Eagles clash.

(Note that at this point there's no Line market for Sunday's Freo v Bulldogs game. I'll update the download file once this information is available.)

Here's to continuing the tradition of MAFL Round 1 success.

Tuesday, March 24, 2009

Waiting on Line

Hmmm. (Just how many ms are there in that word?)

It's Tuesday evening around 7pm and there's still no Line market up on TAB Sportsbet. In the normal course this market would go up at noon on Monday, and that's when the first match is on Friday night. So, this week the first game is 24 hours earlier than normal and the Line market looks as though it'll be delayed by 48 hours, perhaps more.

Curiouser still is the fact that the Head-to-Head market has been up since early March (at least) and there's an historical and strong mathematical relationship between Head-to-Head prices and the Line market, as the following chart shows.


The dark line overlaid on the chart fits the empirical data very well. As you can see, the R-squared is 0.944, which is an R-squared I'd be proud to present to any client.

Using the fitted equation gives the following table of Favourite's Price and Predicted Points Start:


Anyway, back to waiting for the TAB to set the terms of our engagement for the weekend ...

Sunday, March 22, 2009

Marginally Interesting

Here are a handful of facts on AFL margins:
* The largest ever victory margin was 190 points (Fitzroy over Melbourne in 1979)
* Every margin between 0 and 150 points has been achieved at least once except margins of 136, 144, 145, 148 and 149 points.
* Last season, no game finished with a victory margin of 25 points
* No game finished with a margin of 47 points in the previous 2 seasons
* No game finished with a margin of 67 points in the previous 5 seasons
* No game finished with a margin of 90, 94 or 98 points in the previous 8 seasons
* No game finished with a margin of 109 points in the previous 12 seasons
* No game finished with a margin of 120 points in the previous 17 seasons
* No game finished with a margin of 128 points in the previous 39 seasons
* No game finished with a margin of 161 points in the previous 109 seasons
* At least one game has finished with a margin of 6 points in each of the previous 48 seasons
* At least one game has finished with a margin of 26 points in each of the previous 42 seasons

Saturday, March 21, 2009

Draw Doesn't Always Mean Equal

The curse of the unbalanced draw remains in the AFL this year and teams will once again finish in ladder positions that they don't deserve. As long-time MAFL readers will know, this is a topic I've returned to on a number of occasions but, in the past, I've not attempted to quantify its effects.

This week, however, a MAFL Investor sent me a copy of a paper that's been prepared by Liam Lenten of the School of Economics and Finance at La Trobe University for a Research Seminar Series to be held later this month and in which he provides a simple methodology for projecting how each team would have fared had they played the full 30-game schedule, facing every other team twice.


Thursday, March 19, 2009

Limning the Ladder

It's time to consider the grand sweep of football history once again.

This time I'm looking at the teams' finishing positions, in particular the number and proportion of times that they've each finished as Premiers, Wooden Spooners, Grand Finalists and Finalists, or that they've finished in the Top Quarter or Top Half of the draw.

Here's a table providing the All-Time data.


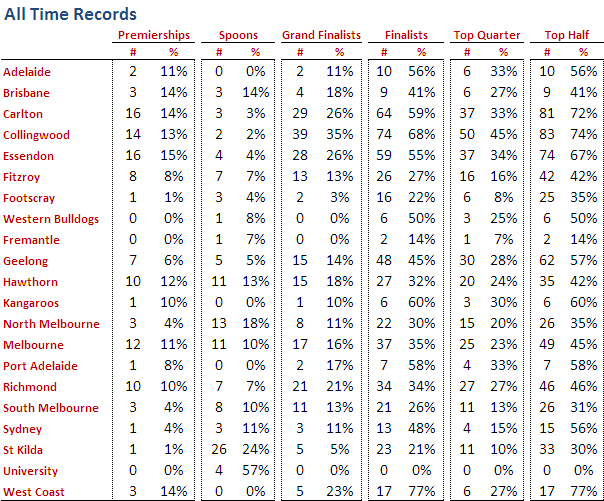
Note that the percentage columns are all as a percentage of opportunities. So, for a season to be included in the denominator for a team's percentage, that team needs to have played in that season and, in the case of the Grand Finalists and Finalists statistics, there needs to have been a Grand Final (which there wasn't in 1897 or 1924) or there needs to have been Finals (which, effectively, there weren't in 1898, 1899 or 1900).

Looking firstly at Premierships, in pure number terms Essendon and Carlton tie for the lead on 16, but Essendon missed the 1916 and 1917 seasons and so have the outright lead in terms of percentage. A Premiership for West Coast in any of the next 5 seasons (and none for the Dons) would see them overtake Essendon on this measure.

Moving then to Spoons, St Kilda's title of the Team Most Spooned looks safe for at least another half century as they sit 13 clear of the field, and University will surely never relinquish the less euphonius but at least equally as impressive title of the Team With the Greatest Percentage of Spooned Seasons. Adelaide, Port Adelaide and West Coast are the only teams yet to register a Spoon (once the Roos' record is merged with North Melbourne's).

Turning next to Grand Finals we find that Collingwood have participated in a remarkable 39 of them, which equates to a better than one season in three record and is almost 10 percentage points better than any other team. West Coast, in just 22 seasons, have played in as many Grand Finals as have St Kilda, though St Kilda have had an additional 81 opportunities.

The Pies also lead in terms of the number of seasons in which they've participated in the Finals, though West Coast heads them in terms of percentages for this same statistic, having missed the Finals less than one season in four across the span of their existence.

Finally, looking at finishing in the Top Half or Top Quarter of the draw we find the Pies leading on both of these measures in terms of number of seasons but finishing runner-up to the Eagles in terms of percentages.

The picture is quite different if we look just at the 1980 to 2008 period, the numbers for which appear below.


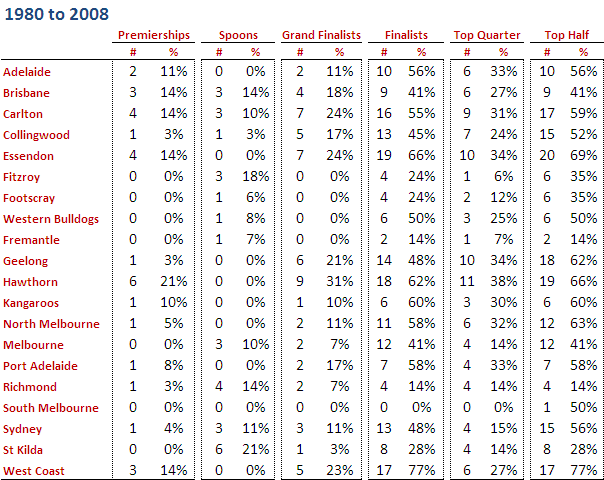
Hawthorn now dominates the Premiership, Grand Finalist and finishing in the Top Quarter statistics. St Kilda still own the Spoon market and the Dons lead in terms of being a Finalist most often and finishing in the Top Half of the draw most often.

West Coast is the team with the highest percentage of Finals appearances and highest percentage of times finishing in the Top Half of the draw.

Wednesday, March 18, 2009

An Important Message for All Investors

The information about each MAFL Fund that I've provided in the downloadable PDF includes how many bets each Fund can be expected to make during the course of the season and how big those bets are likely to be.

For clarity and to avoid surprising anyone, I thought it would be appropriate to re-present some of the data in the PDF from a weekly rather than a whole of season perspective. I've done this in the following table.


So, if you're investing in New Heritage, be aware that it will, if history's any guide, invest at least 25% of the Fund each week and as much as 70% of the Fund in the most extreme weeks. That is a large proportion of the Fund to put at risk but recognise that the average price of the teams on which the Fund wagers is just $1.57. At that price, firstly it's highly unlikely to lose a long string of bets and, secondly, the Fund needs to bet larger amounts in order to generate worthwhile profits.

Similarly, if you've some Chi-squared in your portfolio, be aware that you'll have 25% of the Fund in play about 4 weeks in 10 and around 55% in the most extreme weeks.

Even the Prudence, Hope and Line Redux Funds will occasionally splurge and have 25-35% of Funds at risk, although each of these these Funds will generally be much more sedate than this.

Bearing in mind that it'll only be the Line Redux Fund trading for the first 4 weeks of the season, if you're at all uncomfortable about your portfolio weightings now that you've read this blog you still have plenty of time to advise me of any changes that you'd like to make.

Otherwise, get ready to watch your money work much harder this year.

Tuesday, March 17, 2009

Seeking Significance

Distinguishing between a statistical aberration and a meaningful deviation from what's expected is a skill that's decidedly difficult to acquire. If my train to work is late 15 days out of 20 is that a sign that the train is now permanently more likely to be late than to be early?

The TAB offers a 50:50 proposition bet on every AFL game that the match will end with an even or an odd number of points being scored. I can find no reason to favour one of those outcomes over another, so even money odds seems like a reasonable proposition.

How strange it is then that 6 of the last 8 seasons have finished with a preponderance of games producing an even total. Surely this must be compelling evidence of some fundamental change in the sport that's tilting the balance in favour of even-totalled results. Actually, that's probably not the case.


Monday, March 16, 2009

Percentage of Points Scored in a Game

We statisticians spend a lot of our lives dealing with the bell-shaped statistical distribution known as the Normal or Gaussian distribution. It describes a variety of phenomena in areas as diverse as physics, biology, psychology and economics and is quite frankly the 'go-to' distribution for many statistical purposes.

So, it's nice to finally find a footy phenomenon that looks Normally distributed.


Saturday, March 14, 2009

Is There a Favourite-Longshot Bias in AFL Wagering?

The other night I was chatting with a few MAFL Investors and the topic of the Favourite-Longshot bias - and whether or not it exists in TAB AFL betting - came up. Such a bias is said to exist if punters tend to do better wagering on favourites than they do wagering on longshots.

The bias has been found in a number of wagering markets, among them Major League Baseball, horse racing in the US and the UK, and even greyhound racing. In its most extreme form, so mispriced do favourites tend to be that punters can actually make money over the long haul by wagering on them. I suspect that what prevents most punters from exploiting this situation - if they're aware of it - is the glacial rate at which profits accrue unless large amounts are wagered. Wagering $1,000 on a contest with the prospect of losing it all in the event of an upset or, instead, of winning just $100 if the contest finishes as expected seems, for most punters, like a lousy way to spend a Sunday afternoon.


Tuesday, March 10, 2009

Predicting Ladder Positions

This year I'll be running a special competition in which participants will be asked to predict how the teams will finish on the ladder at the end of the home and away season. Entries will need to be in before the first game of Round 7. More details will be provided in a few weeks time.

In the meantime, here are a few permutations and combinations relating to the ladder, assuming that each team has a 1/16th probability of finishing in any given ladder position:
* How many different ways are there in which the 16 teams could finish this year? Almost 21 billion.
* How many different final 8s are there, including different orderings of the same set of 8 teams?  Over 500 million.
* How many different final 8s are there if we ignore different orderings of the same set of 8 teams?  12,870.
* How many different top 4s are there, including different orderings of the same set of 4 teams?  43,680.
* How many different top 4s are there if we ignore different orderings of the same set of 4 teams?  1,820.
* How many different Grand Final match ups are there? 120.

Those first two numbers neatly explain why there's no market for predicting the finishing order of all teams or for predicting the 8 finalists in order. By way of context, correctly selecting the finishing order of all 16 teams (under the assumptions I've made) is almost 400,000 times more difficult than winning Powerball.

So, predicting the correct finishing order for all 16 teams seems a bit hard. How many could you reasonably expect to get right? Well, again making the assumption that any given team is equally likely to finish in any given ladder position, you should expect to correctly predict the finishing order of just one team (and, you should expect almost 37% of the time to get none at all correct).

Sunday, March 8, 2009

Less Than A Goal In It

Last year, 20 games in the home and away season were decided by less than a goal and two teams, Richmond and Sydney were each involved in 5 of them.

Relatively speaking, the Tigers and the Swans fared quite well in these close finishes, each winning three, drawing one and losing just one of the five contests.

Fremantle, on the other hand, had a particularly bad run in close games last years, losing all four of those it played in, which contributed to an altogether forgettable year for the Dockers.


Saturday, March 7, 2009

Teams' Performances Revisited

In a comment on the previous posting, Mitch asked if we could take a look at each team's performance by era, his interest sparked by the strong all-time performance of the Blues and his recollection of their less than stellar recent seasons.

Here's the data:


So, as you can see, Carlton's performance in the most recent epoch is significantly below its all-time performance. In fact, the 1993-2008 epoch is the only one in which the Blues failed to return a better than 50% performance.

Collingwood, the only team with a better lifetime record than Carlton, have also had a well below par last epoch during which they too have registered their first sub-50% performance, continuing a downward trend which started back in Epoch 2.

Six current teams have performed significantly better in the 1993-2008 epoch than their all-time performance: Geelong (who registered their best ever epoch), Sydney (who cracked 50% for the first time in four epochs), Brisbane (who could hardly but improve), the Western Bulldogs (who are still yet to break 50% for an epoch, their 1945-1960 figure being actually 49.5%), North Melbourne (who also registered their best ever epoch),  and St Kilda (who still didn't manage 50% for the epoch, a feat they've achieved only once).

Just before we wind up I should note that the 0% for University in Epoch 2 is not an error. It's the consequence of two 0 and 18 performances by Uni in 1913 and 1914 which, given that these followed directly after successive 1 and 17 performances in 1911 and 1912, unsurprisingly heralded the club's demise. Given that Uni's sole triumph of 1912 came in the third round, by my calculations that means University lost its final 51 matches.