Thursday, July 30, 2009

Game Cadence

If you were to consider each quarter of football as a separate contest, what pattern of wins and losses do you think has been most common? Would it be where one team wins all 4 quarters and the other therefore losses all 4? Instead, might it be where teams alternated, winning one and losing the next, or vice versa? Or would it be something else entirely?

The answer, it turns out, depends on the period of history over which you ask the question. Here's the data:


So, if you consider the entire expanse of VFL/AFL history, the egalitarian "WLWL / LWLW" cadence has been most common, occurring in over 18% of all games. The next most common cadence, coming in at just under 15% is "WWWW / LLLL" - the Clean Sweep, if you will. The next four most common cadences all have one team winning 3 quarters and the other winning the remaining quarter, each of which such cadences have occurred about 10-12% of the time. The other patterns have occurred with frequencies as shown under the 1897 to 2009 columns, and taper off to the rarest of all combinations in which 3 quarters were drawn and the other - the third quarter as it happens - was won by one team and so lost by the other. This game took place in Round 13 of 1901 and involved Fitzroy and Collingwood.

If, instead, you were only to consider more recent seasons excluding the current one, say from 1980 to 2008, you'd find that the most common cadence has been the Clean Sweep on about 18%, with the "WLLL / "LWWW" cadence in second on a little over 12%. Four other cadences then follow in the 10-11.5% range, three of them involving one team winning 3 of the 4 quarters and the other the "WLWL / LWLW" cadence.

In short it seems that teams have tended to dominate contests more in the 1980 to 2008 period than had been the case historically.

(It's interesting to note that, amongst those games where the quarters are split 2 each, "WLWL / LWLW" is more common than either of the two other possible cadences, especially across the entire history of footy.)

Turning next to the current season, we find that the Clean Sweep has been the most common cadence, but is only a little ahead of 5 other cadences, 3 of these involving a 3-1 split of quarters and 2 of them involving a 2-2 split.

So, 2009 looks more like the period 1980 to 2008 than it does the period 1897 to 2009.

What about the evidence for within-game momentum in the quarter-to-quarter cadence? In other words, are teams who've won the previous quarter more or less likely to win the next?

Once again, the answer depends on your timeframe.

Across the period 1897 to 2009 (and ignoring games where one of the two relevant quarters was drawn):
  • teams that have won the 1st quarter have also won the 2nd quarter about 46% of the time
  • teams that have won the 2nd quarter have also won the 3rd quarter about 48% of the time
  • teams that have won the 3rd quarter have also won the 4th quarter just under 50% of the time.
So, across the entire history of football, there's been, if anything, an anti-momentum effect, since teams that win one quarter have been a little less likely to win the next.

Inspecting the record for more recent times, however, consistent with our earlier conclusion about the greater tendency for teams to dominate matches, we find that, for the periods 1980 to 2008 (and, in brackets, for 2009):
  • teams that have won the 1st quarter have also won the 2nd quarter about 52% of the time a little less in 2009)
  • teams that have won the 2nd quarter have also won the 3rd quarter about 55% of the time (a little more in 2009)
  • teams that have won the 3rd quarter have also won the 4th quarter just under 55% of the time (but only 46% for 2009).
In more recent history then, there is evidence of within-game momentum.

All of which would lead you to believe that winning the 1st quarter should be particularly important, since it gets the momentum moving in the right direction right from the start. And, indeed, this season that has been the case, as teams that have won matches have also won the 1st quarter in 71% of those games, the greatest proportion of any quarter.

Wednesday, July 29, 2009

Will Investors Be Having A Port Whine on Sunday?

Stakes At Stake
Once again this weekend most Investors will find themselves disproportionately concerned about the outcome of a single contest.

Whilst it'll still be possible for a petite profit to be made should Port fail to topple the Hawks at Football Park, a truly memorable weekend will only be had if the upset eventuates.

To the details then.

New Heritage has 4 bets adding up to a little over one-third of the Fund, amongst them a 13.4% wager on the Dogs at a price not statistically significantly different from money back. They're at $1.02. The riskiest bet amongst the New Heritage clutch is 0.7% on Port Adelaide at $2.65. Every Fund has a wager on Port Adelaide this week, which is why Investors care so much about the outcome.

(Speaking of the use of 'clutch' as a collective noun for wagers, a visitor to the MAFL Online website this week arrived having searched on the phrase "clutching betting" using Google. Quite what he or she was truly looking for I'm as yet unable to fathom, but the length of the visit - 0 seconds - suggests he or she didn't find it on the MAFL Online site.)

Prudence has 5 bets totalling about 20% of the Fund. Its largest is also on the Dogs, 7.2% in its case, and its riskiest is 1.5% on Melbourne at $3.30.

Hope has just 2 wagers. Its largest and riskiest wagers is 5.7% on West Coast at $3.30, and its other wager is also on an underdog: 4.48% on Port Adelaide.

Line Redux has a record-equalling 5 wagers this weekend, 3 on teams receiving start and 2 on teams giving start.

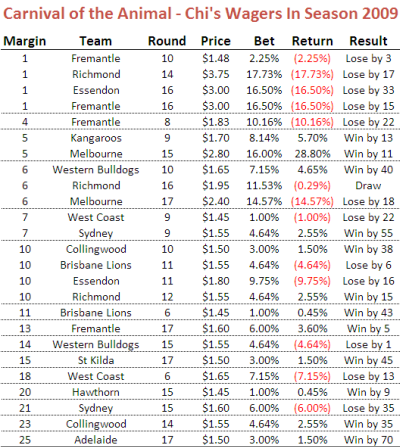
Chi-squared is supporting a dog again this weekend, though whether it's yet another mongrel dog or merely an underdog is yet to be determined. He has 15.6% on Port Adelaide. The evidence does not bode well for this wager given the data in the table below, coupled with the knowledge that he's tipping Port Adelaide by just 3 points.


As you can see, he's 0 from 5 for wagers on teams that he's tipped by 4 points or fewer. Still, based on the wisdom of (generally near-broke) gamblers, I guess that makes him 'due'.

Ready Reckoner
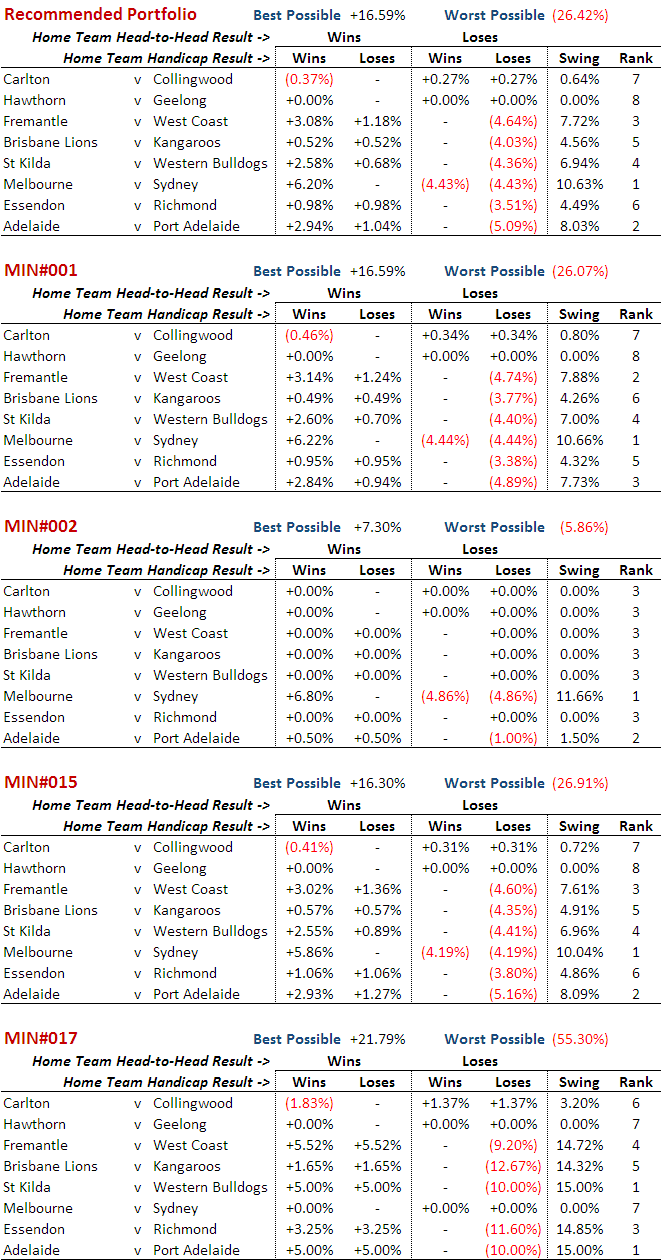
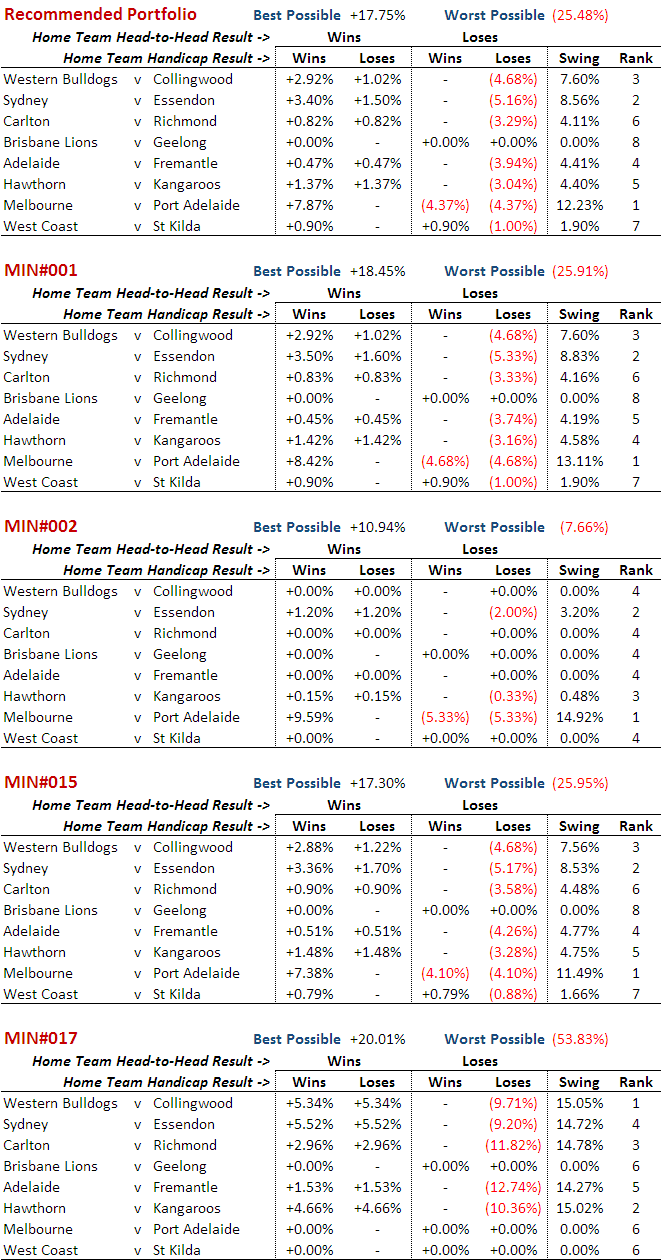
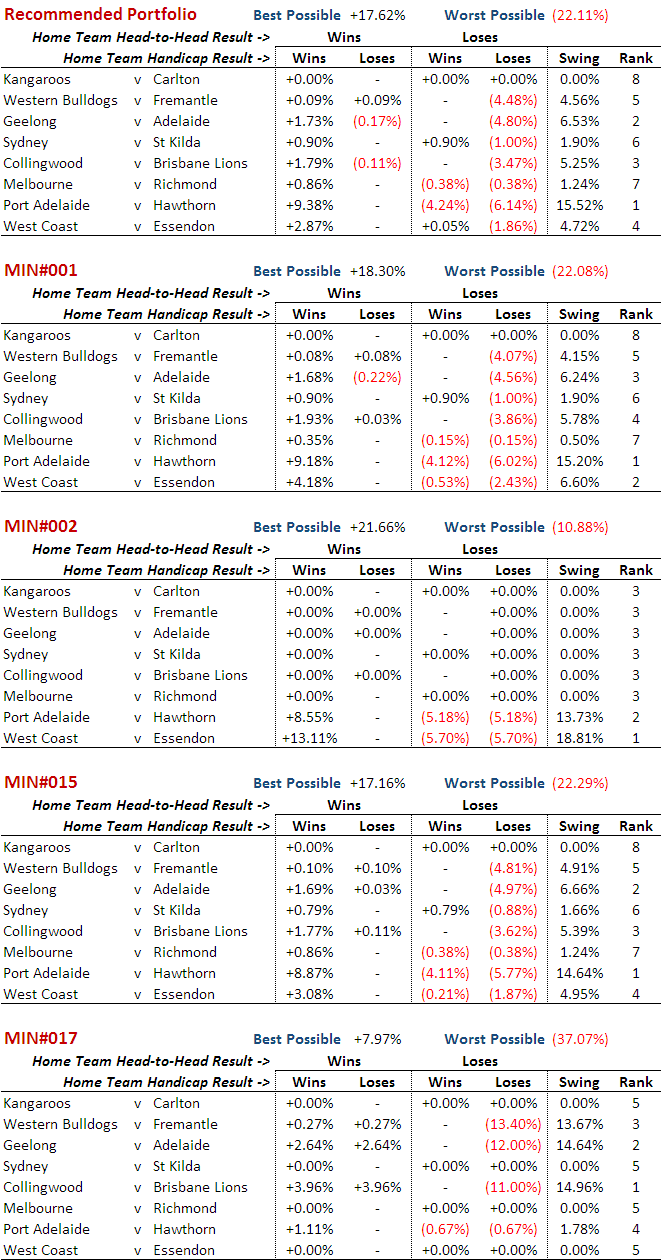
This weekend's Ready Reckoner looks remarkably like this:


For the first time since Round 12, no Investor has an interest - at least on MAFL grounds - in the Friday night fixture. Saturday is, however, moderately important to everyone but MIN#002, and Sunday is screamingly important to everyone except MIN#017.

Tip-top Tipping
On tipping we have no unanimous favourites this week. Here are the details:
* Carlton are 10-3 favourites over the Roos. None of the top 5 tipsters is siding with the Roos.
* The Dogs are 8-5 favourites over Fremantle. Freo's only support amongst the top tipsters comes from STM II, who did tip Essendon to beat Hawthorn at $5 in Round 7, but surely can't be expected to prevail on a team currently at $11.
* Geelong are 10-3 favourites over Adelaide. Amongst the top tipsters only Shadow favours Adelaide.
* St Kilda are 12-1 favourites over Sydney, with Sydney's sole supporter being HSH.
* Collingwood are 7-6 favourites over Brisbane. The Lions count Shadow and STM II amongst their supporters.
* Richmond are 10-3 favourites over Melbourne, though the Dees do have Shadow's and Silhouette's vote.
* Hawthorn are 8-5 favourites over Port Adelaide. Port have a majority of the top 5 tipsters selecting them, however, as Shadow, Silhouette and STM II have lined up behind them. ELO is tipping the Hawks, but only by 4 points, making this its Game of the Round.
* Essendon are 12-1 favourites over West Coast. Once again HSH finds itself in the lonely part of the tipping convention. Chi, though, is tipping the Dons by just a point, making this his Game of the Round.

A Fine Line
On line betting this week, Chi and ELO are of one mind (though I suspect Chi's not contributing much to that entity). They're both implicitly tipping the Roos, Fremantle, Geelong, Sydney, Lions, Melbourne, Port, and West Coast.

Sunday, July 26, 2009

An Honourable (Near) Draw

Investors with the Recommended Portfolio should probably be thankful that they escaped the weekend with just a small loss (0.4%), leaving them still up 4.0% on the season. Melbourne's inability to beat the Swans was the cause of most damage, though the Dons' narrow failure to pip the Tigers didn't help, nor did Freo's inability to cover their 8.5 point spread.

Other Investors lost too, MIN#001 and MIN#015 also only narrowly, and MIN#002 a little more substantially. MIN#017 was the only Investor to show a profit on the weekend. MIN#001 and MIN#015 are now up 7.2% for the season, MIN#002 is up 31%, and MIN#017 is up 38.5%.

Two Funds made profit on the weekend. New Heritage made almost 7% from 5 successful bets out of 6, leaving it ahead by 38.5% on the season, such profit deriving from 50 successful bets out of 66 wagers. Line Redux made 4% from its 2 out of 3 performance, leaving it down just over 1.5% on the season based on 25 successful wagers from 49 bets.

Prudence landed 4 bets from 6 but dropped 1.5% and is now up a little over 12% on the season with a 47 from 63 record. Hope won 1 and lost 1 to drop 4.4% but remains 31% ahead on the season with a 10 from 22 record. Chi-squared landed 3 from 4, but lost the one that mattered and so dropped 8% on the round to move to a loss of 55% on the season due to just 12 successful wagers from 25.

On tipping, BKB had the best performance of the round, snaring 7 from 8 to move to 95.5 from 136 (70.2%), joining Shadow on that score thanks to Shadow's paltry 2 from 8 for the week. Silhouette managed 5 from 8 and continues to lead, now by just 3 tips on 98.5 from 136 (72%).

Chi and ELO both had unremarkable line betting weekends, each bagging 4 from 8.

Chi continues to threaten the 30 points per game Mean Absolute Prediction Error (MAPE) landmark. He's now on 30.2 points per game; ELO's on 28.1 and BKB's on 27.2. As a measure of margin-tipping accuracy, MAPE is a good one, though it is subject to the distorting influence of a view blowout results. A measure that is less susceptible to such results, and one that is therefore preferred by some as a measure of margin-tipping accuracy is the Median Absolute Prediction Error.

For Chi, this measure is 26 points, for BKB it's 23.5 points, and for ELO it's 21.5 points, highlighting just how accurately ELO's been tipping margins this season.

Over on MAFL Stats you can view the latest MARS Ratings and there you'll see that the Saints have grabbed the number 1 ranking from the Cats for the first time this season. Given the Cats' patchy performances over the last month, I think that's probably a fair assessment.

A team-by-team comparison of results also highlights the Saints' superiority, especially against teams higher on the ladder:


In this table results in green are victories and those in red are losses. Where a team is to be played in a future round the details are shown in black. The teams are ordered by current ladder position.

Thursday, July 23, 2009

21 Again

Tonight I thought I'd wait a little longer to see if TAB Sportsbet would post the final 2 line markets before I wrote this blog but, as of a little after 8pm, they've not.

The two line markets awaited are those for the Carlton v Collingwood game, on which I don't expect we'll have a wager, and for the Fremantle v West Coast game, on which I expect we will. This week's Ready Reckoner is based on us having 5% of the Line Redux Fund on Freo, probably giving 9.5 points start. I'll confirm this as soon as I can.

Including the assumed Dockers wager, we'll again have 21 wagers this weekend, though Chi-squared's marginally more temperate behaviour means that Investors will have, in aggregate, less money at risk.

New Heritage has 6 wagers totalling about 55.5% of the Fund, the largest being a 12.7% wager on the Lions at $1.13. The other 5 wagers are each sized 9.2% or larger and are on favourites, the longest priced of which is Fremantle at $1.60.

Prudence also has 6 wagers, totalling almost a quarter of the Fund, and also has its largest wager - 6% in its case - on the Lions. Its most speculative wager though is on the Dees and is for 3.1% at $2.40. (The Dees have blown significantly since we placed this bet, which is rarely a happy portent.)

Chi-squared has found 4 wagers totalling a little over 25% of the Fund. It too fancies the Dees - if 14.6% can rightly be labelled merely a fancy. Its 3 other wagers are on favourites.

Hope has just 2 bets this weekend, 4.9% on the Dees at the aforementioned $2.40, and 1% on the Crows at $1.50.

Line Redux has 3 bets (including the prospective Freo wager), all on teams giving start.

Every Fund has wagered something on the Crows this weekend, making them only the second team this year - the other being Sydney - to earn such unamimous wagering support. There's some proverb about eggs and baskets that I can only vaguely recall at this point.

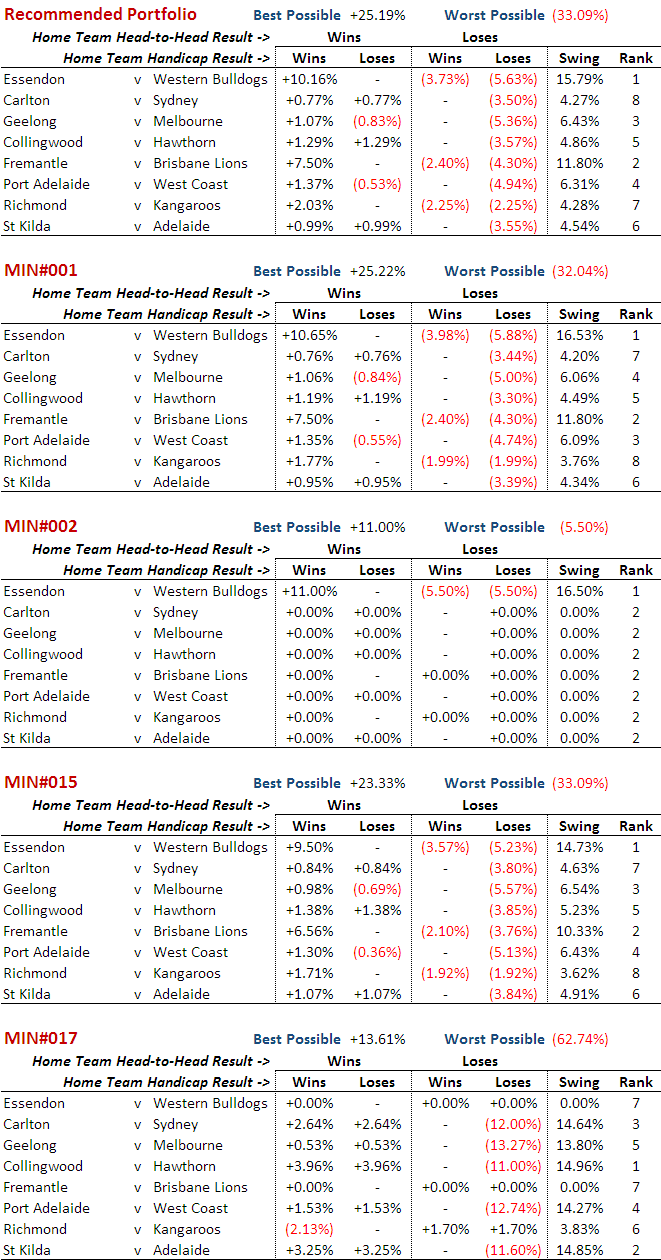
Here then is the weekend's Ready Reckoner:


It's a dark weekend indeed when your fate is in the hands of the Dees, especially when draft picks are at stake.

Next, let's turn to tipping, where we have:
* Carlton 9-4 favourites over Collingwood. Though the Pies have scant support, 3 of their 4 supporters come from amongst our top 5 tipsters in the form of BKB, CTL and Silhouette. ELO tips Carlton, but only by 2 points, making this its Game of the Round.
* Geelong 8-5 favourites over the Hawks. Amongst our tipping elite, only Shadow is on the Hawks. Chi's tipping a Cats victory, but only by 3 points, making this his (only!) Game of the Round.
* Fremantle 7-6 favourites over the Eagles, with CTL, Shadow and Silhouette all tipping the Eagles.
* Brisbane unanimous favourites over the Roos.
* St Kilda, perhaps surprisingly, unanimous favourites over the Dogs.
* Melbourne 7-6 favourites over Sydney, with BKB and CTL the only credentialled tipsters foretelling a Swans victory.
* Essendon 10-3 favourites over the Tigers. STM II stands alone amongst its peers in tipping the Tigers.
* Port Adelaide 7-6 favourites over the Crows, with half of the Crows' support coming from CTL, BKB and Silhouette.

On line betting, assuming Freo give 9.5 points start and Carlton receive 6.5 points start (which, as I type this, is no certainty):
* Chi's on Collingwood, Hawthorn, Fremantle, the Kangaroos, St Kilda, Melbourne, Richmond and Adelaide
* ELO's on Carlton, Hawthorn, West Coast, the Kangaroos, St Kilda, Melbourne, Essendon and Adelaide

Update on Friday morning: Fremantle line wager is confirmed. We're giving only 8.5 start. Also, as expected, no Carlton line bet. New Round Summary now available for download.

July - When a Fan's Thoughts Turn to Tanking

Most major Australian sports have their iconic annual event. Cricket has its Boxing Day test, tennis and golf have their respective Australian Opens, rugby league has the State of Origin series, rugby union the Bledisloe, and AFL, it now seems, has the Tanking Debate, usually commencing near Round 15 or 16 and running to the end of the season proper.

The T-word has been all over the Melbourne newspapers and various footy websites this week, perhaps most startlingly in the form of Terry Wallace's admission that in Round 22 of 2007 in the Tigers clash against St Kilda, a game in which the Tigers led by 3 points at the final change but went on to lose by 10 points:
"while he had not "tanked" during the Trent Cotchin game in Round 22, 2007, he had let the contest run its natural course without intervention"

That stain on the competition's reputation (coupled, I'll admit, with he realisation that the loss cost MAFL Investors an additional return of about 13% for that year) makes it all the more apparent to me that the draft system, especially the priority draft component, must change.

Here's what I wrote on the topic - presciently as it turns out - in the newsletter for Round 19 of 2007.

Tanking and the Draft
If you’re a diehard AFL fan and completely conversant with the nuances of the Draft, please feel free to skip this next section of the newsletter.

I thought that a number of you might be interested to know why, in some quarters, there’s such a fuss around this time of year about “The Draft” and its potential impact on the commitment levels of teams towards the bottom of the ladder.

The Draft is, as Wikipedia puts it, the “annual draft of young talent” into the AFL that takes place prior to the start of each season. In the words of the AFL’s own website:
"In simple terms, the NAB AFL Draft is designed to give clubs which finished lower on the ladder the first opportunity to pick the best new talent in Australia. At season's end, all clubs are allocated draft selections. The club that finished last receives the first selection, the second last team gets the second selection and so on until the premier receives the 16th selection."

So, here’s the first issue: towards season’s end, those teams for whom all hopes of a Finals berth have long since left the stadium find that there’s more to be gained by losing games than there is by winning them.

Why? Well say, for example, that Richmond suddenly remembered what the big sticks are there for and jagged two wins in the last four games, leaping a startled Melbourne in the process, relegating them to position Spoon. The Tigers’ reward for such a stunning effort would be to (possibly – see below) hand Melbourne the sweetest of draft plums, the Number 1 draft pick, while relegating themselves to the Number 2 pick. Now, in truth, over the years, Number 1 picks have not always worked out better than Number 2 picks, but think about it this way: isn’t it always nicer to have first hand into the Quality Assortment?

Now entereth the notion of Priority Picks, which accrue to those teams who have demonstrated season-long ineptitude to the extent that they’ve accumulated fewer than 17 points over its duration. They get a second draft pick prior to everyone else’s second draft pick and then a third pick not that long after, once all the other Priority Picks have taken place. So, for example, if a team comes last and wins, say, four games, it gets Pick #1, Pick #17 (their Priority pick, immediately after all the remaining teams have had their first pick) and then Pick #18 (their true second round Pick). If more than one team is in entitled to Priority Picks then the Picks are taken in reverse ladder order.

Still with me?

Now, the final twist. If a team has proven its footballing inadequacy knows not the bounds of a single year, having done so by securing fewer than 17 points in each of two successive seasons, then it gets its Priority Pick before anyone else gets even their first round pick. Once again, if more than one team is in this situation, then the tips are taken in reverse ladder order.

So, what’s the relevance to this year? Well, last year Carlton managed only 14 points and this year they’re perched precipitously on 16 points. If they lose their next four games, their first three draft picks will be #1 (their Priority Pick), #4 (their first round pick), and #20 (their second round pick); if they win or even draw one or more of their remaining games and do this without leaping a ladder spot, their first three draft picks will be #3, #19 and #35. Which would you prefer?

I find it hard to believe that a professional footballer or coach could ever succumb to the temptation to “tank” games (as it’s called), but the game’s administrators should never have set up the draft process in such a way that it incites such speculation every year around this time.

I can think of a couple of ways of preserving the intent of the current draft process without so blatantly rewarding failure and inviting suspicion and rumour. We’ll talk about this some more next week.

*****

In the following week's newsletter, I wrote this:

Revising the Draft
With the Tigers and the Dees winning last week, I guess many would feel that the “tanking” issue has been cast aside for yet another season. Up to a point, that’s probably a fair assessment, although only a win by the Blues could truly muffle all the critics.

Regardless, as I said last week, it’s unfair to leave any of the teams in a position where they could even be suspected of putting in anything other than a 100% effort.

I have two suggestions for changes to the draft that would broadly preserve its intent but that would also go a long way to removing much of the contention that currently exists.

(1) Randomise the draft to some extent. Sure, give teams further down the ladder a strong chance of getting early draft picks, but don’t make ladder position completely determine the pick order. One way to achieve this would be to place balls in an urn with the number of balls increasing as ladder position increased. So, for example, the team that finished 9th might get 5 balls in the urn; 10th might get 6 balls, and so on. Then, draw from this urn to determine the order of draft picks.
Actually, although it’s not strictly in keeping with the current spirit of the draft, I’d like to see this system used in such a way that marginally more balls are placed in the urn for teams higher up the ladder to ensure that all teams are still striving for victory all the way to Round 22.

(2) Base draft picks on ladder position at the end of Round 11, not Round 22.
Sides that are poor performers generally don’t need 22 rounds to prove it; 11 rounds should be more than enough. What’s more, I reckon that it’s far less likely that a team would even consider tanking say rounds 9, 10 and 11 when there’s still so much of the season to go that a spot in the Finals is not totally out of the question. With this approach I’d be happy to stick with the current notion that 1st draft pick accrues to the team at the foot at the ladder.

Under either of these new draft regimes, the notion of Priority Picks has to go. Let’s compensate for underperformance but not lavish it with silken opportunity.

****

My opinion hasn't changed. The changes to the draft for the next few years that have been made to smooth the entry of the Gold Coast into the competition probably mean that we're stuck with a version of the draft we have now for the next few years. After that though, we do have to fix it because it is broken.

Wednesday, July 22, 2009

The Differential Difference

Though there are numerous differences between the various football codes in Australia, two that have always struck me as arbitrary are AFL's awarding of 4 points for a victory and 2 from a draw (why not, say, pi and pi/2 if you just want to be different?) and AFL's use of percentage rather than points differential to separate teams that are level on competition points.

I'd long suspected that this latter choice would only rarely be significant - that is, that a team with a superior percentage would not also enjoy a superior points differential - and thought it time to let the data speak for itself.

Sure enough, a review of the final competition ladders for all 112 seasons, 1897 to 2008, shows that the AFL's choice of tiebreaker has mattered only 8 times and that on only 3 of those occasions (shown in grey below) has it had any bearing on the conduct of the finals.


Historically, Richmond has been the greatest beneficiary of the AFL's choice of tiebreaker, being awarded the higher ladder position on the basis of percentage on 3 occasions when the use of points differential would have meant otherwise. Essendon and St Kilda have suffered most from the use of percentage, being consigned to a lower ladder position on 2 occasions each.

There you go: trivia that even a trivia buff would dismiss as trivial.

Tuesday, July 21, 2009

Who'll Be There in September (Maybe)?

With just 6 rounds to go in the competition, a few articles are emerging about how the teams will fare over the remainder of the season and, most importantly, who'll finish where in the top 8.

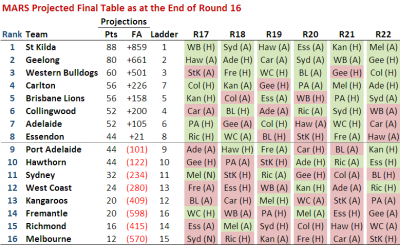
Using the MARS Ratings from MAFL Stats I've also predicted the results for the remainder of the season, details of which appear below:


On the right of the table I've provided the game-by-game projections for each team. Green boxes denote victories, red losses, and a bracketed "H", "A" or "N" denote Home, Away and Neutral Ground venues respectively.

If these projections are accurate, there's not a lot of change that we'll see amongst the top 8. In fact, we'll see no change at all in terms of its membership and only a couple of significant changes in terms of its ordering.

Carlton, I'm forecasting, will leap 3 places and secure a top 4 spot, beating Collingwood (currently 4th), the Roos (12th), Port (9th), Melbourne (15th), and Adelaide (6th) in so doing, losing only to the 2nd-placed Geelong in Round 19. This string of results will draw Carlton level with the Lions on 56 points, but will see them grab 4th with a superior percentage.

Collingwood will surrender their top 4 spot, dropping to 6th due to losses to Carlton (7th), Adelaide (6th), and the Dogs (3rd). Victories over the Lions (5th), Richmond (14th), and Sydney (11th) won't be enough.

Port Adelaide and Hawthorn are projected to finish level with the Dons on 44 points but will miss a spot in the eight on percentages, in Hawthorn's case despite finishing the season with a three-game winning streak.

Monday, July 20, 2009

The Decline of the Humble Behind

Last year, you might recall, a spate of deliberately rushed behinds prompted the AFL to review and ultimately change the laws relating to this form of scoring.

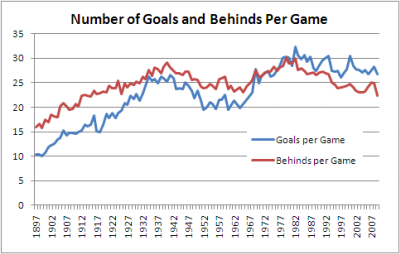
Has the change led to a reduction in the number of behinds recorded in each game? The evidence is fairly strong:


So far this season we've seen 22.3 behinds per game, which is 2.6 per game fewer than we saw in 2008 and puts us on track to record the lowest number of average behinds per game since 1915. Back then though goals came as much more of a surprise, so a spectator at an average game in 1915 could expect to witness only 16 goals to go along with the 22 behinds. Happy days.

This year's behind decline continues a trend during which the number of behinds per game has dropped from a high of 27.3 per game in 1991 to its current level, a full 5 behinds fewer, interrupted only by occasional upticks such as the 25.1 behinds per game recorded in 2007 and the 24.9 recorded in 2008.

While behind numbers have been falling recently, goals per game have also trended down - from 29.6 in 1991, to this season's current average of 26.8. Still, AFL followers can expect to witness more goals than behinds in most games they watch. This wasn't always the case. Not until the season of 1969 had there been a single season with more goals than behinds, and not until 1976 did such an outcome became a regular occurrence. In only one season since then, 1981, have fans endured more behinds than goals across the entire season.

On a game-by-game basis, 90 of 128 games this season, or a smidge over 70%, have produced more goals than behinds. Four more games have produced an equal number of each.

As a logical consequence of all these trends, behinds have had a significantly smaller impact on the result of games, as evidenced by the chart below which shows the percentage of scoring attributable to behinds falling from above 20% in the very early seasons to around 15% across the period 1930 to 1980, to this season's 12.2%, the second-lowest percentage of all time, surpassed only by the 11.9% of season 2000.


(There are more statistical analyses of the AFL on MAFL Online's sister site at MAFL Stats.)

Does The Favourite Have It Covered?

You've wagered on Geelong - a line bet in which you've given 46.5 points start - and they lead by 42 points at three-quarter time. What price should you accept from someone wanting to purchase your wager? They also led by 44 points at quarter time and 43 points at half time. What prices should you have accepted then?

In this blog I've analysed line betting results since 2006 and derived three models to answer questions similar the one above. These models take as inputs the handicap offered by the favourite and the favourite's margin relative to that handicap at a particular quarter break. The output they provide is the probability that the favourite will go on to cover the spread given the situation they find themselves in at the end of some quarter.

The chart below plots these probabilities against margins relative to the spread at quarter time for 8 different handicap levels.


Negative margins mean that the favourite has already covered the spread, positive margins that there's still some spread to be covered.

The top line tracks the probability that a 47.5 point favourite covers the spread given different margins relative to the spread at quarter time. So, for example, if the favourite has the spread covered by 5.5 points (ie leads by 53 points) at quarter time, there's a 90% chance that the favourite will go on to cover the spread at full time.

In comparison, the bottom line tracks the probability that a 6.5 point favourite covers the spread given different margins relative to the spread at quarter time. If a favourite such as this has the spread covered by 5.5 points (ie leads by 12 points) at quarter time, there's only a 60% chance that this team will go on to cover the spread at full time. The logic of this is that a 6.5 point favourite is, relatively, less strong than a 47.5 point favourite and so more liable to fail to cover the spread for any given margin relative to the spread at quarter time.

Another way to look at this same data is to create a table showing what margin relative to the spread is required for an X-point favourite to have a given probability of covering the spread.


So, for example, for the chances of covering the spread to be even, a 6.5 point favourite can afford to lead by only 4 or 5 (ie be 2 points short of covering) at quarter time and a 47.5 point favourite can afford to lead by only 8 or 9 (ie be 39 points short of covering).

The following diagrams provide the same chart and table for the favourite's position at half time.


Finally, these next diagrams provide the same chart and table for the favourite's position at three-quarter time.


I find this last table especially interesting as it shows how fine the difference is at three-quarter time between likely success and possible failure in terms of covering the spread. The difference between a 50% and a 75% probability of covering is only about 9 points and between a 75% and a 90% probability is only 9 points more.

To finish then, let's go back to the question with which I started this blog. A 46.5 point favourite leading by 42 points at three-quarter time is about a 69.4% chance to go on and cover. So, assuming you backed the favourite at $1.90 your expected payout for a 1 unit wager is 0.694 x 0.9 - 0.306 = +0.32 units. So, you'd want to be paid 1.32 units for your wager, given that you also want your original stake back too.

A 46.5 point favourite leading by 44 points at quarter time is about an 85.5% chance to go on and cover, and a similar favourite leading by 43 points at half time is about an 84.7% chance to go on to cover. The expected payouts for these are +0.62 and +0.61 units respectively, so you'd have wanted about 1.62 units to surrender these bets (a little more if you're a risk-taker and a little less if you're risk-averse, but that's a topic for another day ...)

Sunday, July 19, 2009

Sometimes, Seven Goals Just Isn't Enough

You might think, if you'd wagers on three teams (albeit outsiders) that led by 8, 7 and 42 points at half time, that at least one of them would take home the biscuits, especially the one that led by 42 points. If you'd thought this over the last weekend, you'd be wrong.

The Dons were the first of the disappointments, leading the Dogs by 8 points at the half only to concede 11 goals in the second half to go down by 33 points. Next came Fremantle, who enjoyed a 7 point buffer at the half and who maintained legitimate hopes until late in the final term only to falter in the wet against the Lions and lose eventually by 15 points.

Then, on Sunday, the Tigers, who led by 7 straight goals (yes, 7) at the half, barely managed to cling on for a draw, which was enough to stop Investors losing a great deal on the game, but wasn't enough to provide them with a profit. In draws, head-to-head wagers pay out at half-price, so teams at prices below $2 pay back less than the amount wagered. Investors had the Tigers at $1.95.

Indeed it was a weekend littered with close finishes for many Investors. The Cats lost on line betting by half a point, Freo won on line betting by two and a half points, and Port won on line betting by a point and a half. Still, most Investors would've swapped those two favourable line betting results for a Tigers head-to-head victory.

In total, New Heritage won 4.5 of 6 wagers and fell 3.3%, Prudence won 4.5 of 7 wagers and fell 4.2%, Hope lost its only bet and fell 5.5%, Chi-squared won 0.5 of 3 wagers and fell a precipitous 33.3%, and Line Redux won 2 of 4 wagers and fell 1%.

As a result, the Recommended Portfolio fell 9.4% to leave it just 4.5% ahead for the season. Other Portfolios fell by between 3.3% and 9.5% to leave them in front for the season by amounts ranging from 7.5% to 35.4%.

On tipping, RYL had the best possible round, landing 7.5 from 8. Silhouette and Shadow bagged 6.5 and 5.5 respectively to jointly lead outright on 93.5 from 128 (73%), 5 tips ahead of BKB on 88.5 from 128 (69%) and a further tip ahead of CTL and STM II on 87.5 from 128 (68%).

Level-stake, home team only, start at Round 6 wagering on the heuristic tipsters has now been profitable for all tipsters except ELO, Chi and HSH. Shadow, Silhouette and STM II are currently up by over 11 units using such a wagering strategy - if only we'd known ...

Chi's and ELO's line betting results were once again poor this weekend, with Chi scoring 3 from 8 and ELO just 2 from 8.

All told, a weekend best forgotten.

Thursday, July 16, 2009

Clutch Betting

The English language has many wondrous, often euphonious collective nouns ready to serve as descriptors for sets of objects, especially animals. So we have, for example, an exultation of larks, a murder of crows, a gaggle of geese, a cloud of bats, a flutter of butterflies, a cackle of hyenas, a smack of jellyfish, a deceit of lapwing, a richness of martens, a parliament of owls, a watch of nightingales and - a personal favourite - a prickle of porcupines.

English lacks, however, a collective noun for a group of bets, a deficiency I feel needs to be remedied. Accordingly, I'm nominating the word 'clutch' for this purpose.

Its appropriateness can be argued on a number of fronts.

Firstly, the word clutch evokes images of an anxious punter, betting slips gripped tightly in hand, attention riveted on a large screen that's beaming the performance of some two- or four-legged determiner of his or her fate. Surely such a punter can be said to be in the clutch.

The word's also evocative of the notion of 'clutching at straws', a desperate and generally futile exercise, which can seem an especially apposite metaphor some weekends.

Further and more positively, the term 'clutch' already has a sporting pedigree as an honorific applied to the exalted few who can be expected to perform when it matters - hence 'clutch' putter, 'clutch' hitter, 'clutch' pitcher and, more generally, 'clutch' player.

Clutch it it then.

This weekend Investors most certainly face a clutch of bets, 21 in all for the second weekend in a row, and 8 of them on underdogs priced as high as $3.

Chi-squared's own clutch is the scariest. Three bets totalling over 44% of the Fund, the two largest on Essendon and Fremantle both at $3 and both facing teams that are fighting for top 8 and possible top 4 positions. The remaining bet is on Richmond, also the underdogs, but they're only at $1.95 and the bet is relatively small.

New Heritage is also putting a large proportion of the Fund at risk - just under 63% of the Fund on 6 teams, all of them favourites and all but one of them home teams. The largest wager is just over 13% of the Fund on Geelong at what others might call an unbackable $1.04. The smallest wager is just over 2% on the Roos at $1.80 away to the Tigers.

Prudence, as has been its habit for most of the season, has this week nibbled on a smorgasbord of teams rather than gorging on just a few. It has 7 bets totalling a little over 30% of the Fund, 2 of them on underdogs and including a surprising 2% wager on the Dons at $3. The largest wager is for a trifle under 7% of the Fund on the Cats at $1.04.

Line Redux has four wagers representing 20% of the Fund. Two of these wagers are on favourites (Geelong and Port Adelaide) and the other 2 are on underdogs (Essendon and Fremantle).

(There is still one line market to be posted - that for the Tigers v Roos clash - but I don't expect we'll have a bet in it.)

Hope, whose selectivity has been its hallmark this season, has only 1 bet this week, its 20th of the season and its 6th on the Dons. It has 5.5% of the Fund on them at $3.

Together these bets yield the following Ready Reckoner:


The entire tenor of the weekend will be established late on Friday night for all Investors except MIN#017, though even a Dons win won't make the weekend entirely pot-hole resistant.

Next we move to tipping where we find:
* Essendon are 8-5 favourites over the Dogs. Amongst our top 5 tipsters, Silhouette, BKB and CTL have sided with the Dogs, while Shadow and STM II (along with a cadre of anxious MAFL Investors and a badly-bred Pomeranian) are riding the Don train. Chi could definitely be more convincing in his Dondom - he has them as only 1 point winners making this game one of his two Games of the Round.
* Carlton are unanimous favourites over the suddenly unpopular Swans.
* Geelong are 8-5 favourites over the Dees, the narrowness of their favouritism due mostly to the shortness of the memories of many of our heuristic-based tipsters. Amongst the cream of these tipsters, only Shadow and STM II are lining up behind the Dees in what will surely be the shortest of queues.
* Collingwood are 8-5 favourites over the Hawks. Once again it's only Shadow and STM II from the top 5 tipsters who are supporting the underdogs.
* Brisbane are 11-2 favourites over Fremantle, the sole support for the Dockers coming from HSH and Chi, who has this as his second and final Game of the Round.
* Port Adelaide are unanimous favourites over the Eagles.
* The Roos are 8-5 favourites over Richmond. The Tigers' following amongst our top tipsters is thin: only STM II is in their corner. ELO is another Tigers tipper, though only by 6 points, making this its Game of the Round.
* St Kilda are 11-2 favourites over the Crows, with EI I and II the only ornithologists amongst the MAFL tipsters.

On line betting, ELO will surely improve on its 0 from 8 record last weekend, though I'm not as certain that Chi will better his 3 from 8 performance. This week:
* Chi's on: Essendon, Sydney, Melbourne, Collingwood, Fremantle, West Coast, Richmond and Adelaide.
* ELO's on: Essendon, Sydney, Geelong, Collingwood, Brisbane Lions, West Coast, Richmond and St Kilda.

On Line Betting this year teams receiving start have fared much better than those giving it. The current tally is 69-51 in favour of the teams receiving start. The teams with the best records when receiving start are Carlton (4-0), St Kilda (3-0), Brisbane (4-1), and West Coast (8-3). Those with the poorest records when giving start are Fremantle (0-4), West Coast (0-4), Hawthorn (1-11), Port Adelaide (3-6), Adelaide (2-4), Sydney (2-4), Geelong (6-9) and Carlton (4-7).
One last statistic before I go. Which teams do you think have the best and worst win-loss records this year in games that have been decided by fewer than 12 points?

Three teams have perfect records: Essendon (2-0), St Kilda (2-0) and Adelaide (1-0). The Hawks (3-1) also have a strongly positive record. The worst, or perhaps the unluckiest, team in these situations has been Carlton (1-4), followed by 5 teams - Collingwood, Port Adelaide, Richmond, West Coast and the Western Bulldogs - all with 1-2 records.

No team has failed to register at least one result where the margin of victory or defeat has been 11 points or fewer.

Tuesday, July 14, 2009

Are Footy HAMs Normal?

Okay, this is probably going to be a long blog so you might want to make yourself comfortable.

For some time now I've been wondering about the statistical properties of the Handicap-Adjusted Margin (HAM). Does it, for example, follow a normal distribution with zero mean?

Well firstly we need to deal with the definition of the term HAM, for which there is - at least - two logical definitions.

The first definition, which is the one I usually use, is calculated from the Home Team perspective and is Home Team Score - Away Team Score + Home Team's Handicap (where the Handicap is negative if the Home Team is giving start and positive otherwise). Let's call this Home HAM.

As an example, if the Home Team wins 112 to 80 and was giving 20.5 points start, then Home HAM is 112-80-20.5 = +11.5 points, meaning that the Home Team won by 11.5 points on handicap.

The other approach defines HAM in terms of the Favourite Team and is Favourite Team Score - Underdog Team Score + Favourite Team's Handicap (where the Handicap is always negative as, by definition the Favourite Team is giving start). Let's call this Favourite HAM.

So, if the Favourite Team wins 82 to 75 and was giving 15.5 points start, then Favourite HAM is 82-75-15.5 = -7.5 points, meaning that the Favourite Team lost by 7.5 points on handicap.

Home HAM will be the same as Favourite HAM if the Home Team is Favourite. Otherwise Home HAM and Favourite HAM will have opposite signs.

There is one other definitional detail we need to deal with and that is which handicap to use. Each week a number of betting shops publish line markets and they often differ in the starts and the prices offered for each team. For this blog I'm going to use TAB Sportsbet's handicap markets.

TAB Sportsbet Handicap markets work by offering even money odds (less the vigorish) on both teams, with one team receiving start and the other offering that same start. The only exception to this is when the teams are fairly evenly matched in which case the start is fixed at 6.5 points and the prices varied away from even money as required. So, for example, we might see Essendon +6.5 points against Carlton but priced at $1.70 reflecting the fact that 6.5 points makes Essendon in the bookie's opinion more likely to win on handicap than to lose. Games such as this are problematic for the current analysis because the 'true' handicap is not 6.5 points but is instead something less than 6.5 points. Including these games would bias the analysis - and adjusting the start is too complex - so we'll exclude them.

So, the question now becomes is HAM Home, defined as above and using the TAB Sportsbet handicap and excluding games with 6.5 points start or fewer, normally distributed with zero mean? Similarly, is HAM Favourite so distributed?

We should expect HAM Home and HAM Favourite to have zero means because, if they don't it suggests that the Sportsbet bookie has a bias towards or against Home teams of Favourites. And, as we know, in gambling, bias is often financially exploitable.

There's no particular reason to believe that HAM Home and HAM Favourite should follow a normal distribution, however, apart from the startling ubiquity of that distribution across a range of phenomena.

Consider first the issue of zero means.

The following table provides information about Home HAMs for seasons 2006 to 2008 combined, for season 2009, and for seasons 2006 to 2009. I've isolated this season because, as we'll see, it's been a slightly unusual season for handicap betting.


Each row of this table aggregates the results for different ranges of Home Team handicaps. The first row looks at those games where the Home Team was offering start of 30.5 points or more. In these games, of which there were 53 across seasons 2006 to 2008, the average Home HAM was 1.1 and the standard deviation of the Home HAMs was 39.7. In season 2009 there have been 17 such games for which the average Home HAM has been 14.7 and the standard deviation of the Home HAMs has been 29.1.

The asterisk next to the 14.7 average denotes that this average is statistically significantly different from zero at the 10% level (using a two-tailed test). Looking at other rows you'll see there are a handful more asterisks, most notably two against the 12.5 to 17.5 points row for season 2009 denoting that the average Home HAM of 32.0 is significant at the 5% level (though it is based on only 8 games).

At the foot of the table you can see that the overall average Home HAM across seasons 2006 to 2008 was, as we expected approximately zero. Casting an eye down the column of standard deviations for these same seasons suggests that these are broadly independent of the Home Team handicap, though there is some weak evidence that larger absolute starts are associated with slightly larger standard deviations.

For season 2009, the story's a little different. The overall average is +8.4 points which, the asterisks tell us, is statistically significantly different from zero at the 5% level. The standard deviations are much smaller and, if anything, larger absolute margins seem to be associated with smaller standard deviations.

Combining all the seasons, the aberrations of 2009 are mostly washed out and we find an average Home HAM of just +1.6 points.

Next, consider Favourite HAMs, the data for which appears below:


The first thing to note about this table is the fact that none of the Favourite HAMs are significantly different from zero.

Overall, across seasons 2006 to 2008 the average Favourite HAM is just 0.1 point; in 2009 it's just -3.7 points.

In general there appears to be no systematic relationship between the start given by favourites and the standard deviation of the resulting Favourite HAMs.

Summarising:
* Across seasons 2006 to 2009, Home HAMs and Favourite HAMs average around zero, as we hoped
* With a few notable exceptions, mainly for Home HAMs in 2009, the average is also around zero if we condition on either the handicap given by the Home Team (looking at Home HAMs) or that given by the Favourite Team (looking at Favourite HAMs).

Okay then, are Home HAMs and Favourite HAMs normally distributed?

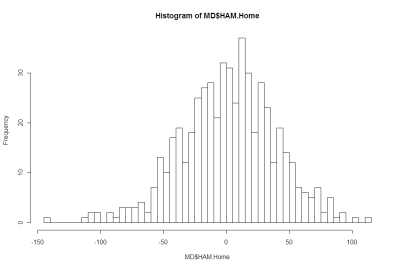
Here's a histogram of Home HAMs:


And here's a histogram of Favourite HAMs:


There's nothing in either of those that argues strongly for the negative.

More formally, Shapiro-Wilks tests fail to reject the null hypothesis that both distributions are Normal.

Using this fact, I've drawn up a couple of tables that compare the observed frequency of various results with what we'd expect if the generating distributions were Normal.

Here's the one for Home HAMs:


There is a slight over-prediction of negative Home HAMs and a corresponding under-prediction of positive Home HAMs but, overall, the fit is good and the appropriate Chi-Squared test of Goodness of Fit is passed.

And, lastly, here's the one for Home Favourites:


In this case the fit is even better.

We conclude then that it seems reasonable to treat Home HAMs as being normally distributed with zero mean and a standard deviation of 37.7 points and to treat Favourite HAMs as being normally distributed with zero mean and, curiously, the same standard deviation. I should point out for any lurking pedant that I realise neither Home HAMs nor Favourite HAMs can strictly follow a normal distribution since Home HAMs and Favourite HAMs take on only discrete values. The issue really is: practically, how good is the approximation?

This conclusion of normality has important implications for detecting possible imbalances between the line and head-to-head markets for the same game. But, for now, enough.

Sunday, July 12, 2009

Favourites Stumble While (Most) Investors Profit

When you lose your first 9 wagers of the weekend and when you've a strategy built around favourites and half of them lose, you're not really entitled to expect to profit from such a weekend, especially when such profit is largely dependent on the team that's at the foot of the ladder toppling a team vying for a spot in the finals and the major wager on that team is one that's been placed by a canine whose to-do list comprises sleep, eat and beg for pats in varying orders.

So, it's with some relief that I report that the Recommended Portfolio and all but one Investor finished in the black this weekend.

Three Funds declined: New Heritage, which won 3 of 5 bets but declined by just under 10%; Prudence, which landed 4 from 6 bets but fell by 1%; and Line Redux, which was right only 1 time in 3 and consequently fell 5.5%. The two successful funds were Hope, which was right 2 times in 3 and rose almost 8%, and Chi-squared, which picked 2 from 4 but rose almost 19%, ensuring that Chi gets fed for another week.

In total that left the Recommended Fund up about another 1.5% and other portfolios up by amounts ranging from 1% to 8%, the only exception being the portfolio of MIN #017, which is down by almost 10% this week though still up almost 35% across the season.

On tipping, Shadow led the way with 6 from 8, propelling it to outright lead on 88 from 120 (73%), now one tip ahead of Silhouette in 2nd and a remarkable 6 tips ahead of BKB on 82 in 4th. Never have the bookies seemed so fallible.

On level-stake, home team only, starting in Round 6 wagering (one day I'll come up with a neat shorthand for that), all but one tipster, ELO, remain profitable.

Indeed, ELO posted something of a record this weekend, landing no line bets at all, three fewer than even Chi managed. Still, line betting based on ELO margin predictions would have been profitable across the entire season, albeit now only by 2.57 units. ELO still has an impressive MAPE of 28.2 points per game, just 0.3 points behind BKB and 2.3 points ahead of Chi.

Fremantle's capitulation to the Crows on Saturday shouldn't go unremarked. Freo recorded just 8 scoring shots (7 of them behinds) to Adelaide's 35, meaning that Freo registered only 19% of the scoring shots in the same. In the entire history of VFL/AFL, spanning more than 13,500 games, only 76 teams have kicked a smaller proportion of scoring shots, and only 3 have done so in the seasons from 1980 onwards. Oddly enough, the most recent of these was this season - in Round 5 when Geelong thumped the Lions 18.18 to 5.3. Prior to that, you need to hark back to Round 13 of 1996 when Geelong beat Fitzroy 25.16 to 6.3. Before that you need to return to Round 14 of 1981 when a wayward Carlton thumped Footscray 15.25 to 5.4. So, truly an historic occasion, though not one you'd expect Dockers fans to commit to memory.

Wednesday, July 8, 2009

A Blackjack of Wagers

What is it they say again about old dogs and new tricks?

Buoyed - or perhaps blinded - by recent successes, the Funds have launched a record-equalling 21-bet salvo at the very much suspecting TAB Sportsbet bookie, amongst these wagers another fur-raiser from Chi. He's made 4 wagers this week totalling about 27.5% of the Fund, 3 of them on favourites, but the fourth on Melbourne at $2.80. Such is his faith on the Dees' going back-to-back he's put 16% of the Fund at risk.

Chi's faith in the Dees is mirrored, though with considerably less conviction, by Prudence and Hope, as odd a pairing in wagering as they are in life. Prudence has about 1.5% on the Dees as one of its 6 wagers for the weekend, which total around 20% of the Fund. Its other wagers are on teams ranging in price from $1.12 (Adelaide, 5.6%) to $1.60 (Sydney 3.3%).

Hope has 5.3% on the Dees and two other wagers: 2% on Sydney at $1.60, and 0.3% on Hawthorn at $1.45. In total Hope has put about 7.5% of the Fund at risk.

New Heritage has nothing on the Dees but has 54% of the Fund on 5 other teams. The largest wager is 12.7% on Adelaide at $1.12 and the most improbable is 9.2% on Sydney at $1.60. New Heritage's aggregate wagering of 54% in this round is its third-highest aggregate for the season, trailing only the 64% of Round 13 and the 60% of Round 7.

Line Redux has found 3 acceptable risks for the weekend: the Dogs giving the Pies 12.5 points start, Sydney giving Essendon 8.5 points start, and West Coast receiving 32.5 points start from the Saints.

Looking at the wagers across the Funds I note that Sydney, for the second time this season, finds itself with a wager from every Fund. No other team has enjoyed such unanimous support even once, let alone twice, from our 5 Funds this season.

In total, those Investors with the Recommended Portfolio have about 24% of their Initial Funds at risk, which is the second highest aggregate this season, behind only the proportion that was at risk in Round 13, which was 0.6% higher.

Here's the week's Ready Reckoner:


On tipping:
* The Dogs are 12-1 favourites over the Pies, with FTS the only Pie-eyed tipster.
* Sydney are 8-5 favourites over the Dons, though the Dons have the support of 4 of our top 5 tipsters, excluding only BKB. ELO is tipping an 11-point Sydney win and has this as its Game of the Round.
* Carlton are unanimous favourites over the Tigers.
* Geelong are 12-1 favourites over the Lions. HSH, as has often been the case this season, finds itself the lone tipster supporting the underdogs. Chi, though siding with the Cats, predicts only a 5-point margin making this one of his two Games of the Round [he's trying to cut back to just a couple a week].
* Adelaide are unanimous favourites over Fremantle.
* Hawthorn are 11-2 favourites over the Roos. The Roos' 2 supporters include the highly-ranked STM II and the lesser-ranked EI I.
* Port Adelaide are 9-4 favourites over the Dees. Amongst the Dee-favourers are Shadow and STM II. Chi also tips the Dees but by only 5 points, making this his Alternative Game of the Round.
* St Kilda are 12-1 favourites over West Coast and it's once again HSH that is the outlier.

On line betting:
* Chi favours: the Dogs, Sydney, Carlton, Brisbane, Fremantle, Hawthorn, Melbourne and West Coast
* ELO favours: the Dogs, Sydney, Carlton, Geelong, Fremantle, Hawthorn, Port Adelaide and St Kilda

I was reviewing the extended ladder (which can be downloaded from the MAFL Stats site each week) and noticed how strong the Saints' defence has been this season. While their attack has been more than acceptable - they rank 3rd overall in terms of points scored - their defence has been 250 points better than any other team in the league. That's almost 3 goals better per game.

Adelaide, 5th on the ladder, are another team whose success has been based more on defence than attack. They're ranked 9th on Points For and 4th on Points Against. Carlton, who sit 7th on the ladder, have instead relied on attack. The opposite of the Crows, the Blues are ranked 4th on Points For and 9th on Points Against.

In general, defence has had a larger bearing on teams' competition points so far this season than has attack, as evidenced by the slightly higher (in absolute terms) correlation between Competition Points and Points Against (-0.92) than between Competition Points and Points For (+0.85). Put another way, variation in Points Against explains about 12% more (ie 0.92 squared vs 0.85 squared) of the variation in Competition Points than does Points For.

Monday, July 6, 2009

Another Look At Quarter-by-Quarter Performance

It's been a while since we looked at teams' quarter-by-quarter performances. This blog looks to redress this deficiency.

(By the way, the Alternative Premierships data is available as a PDF download on the MAFL Stats website .)

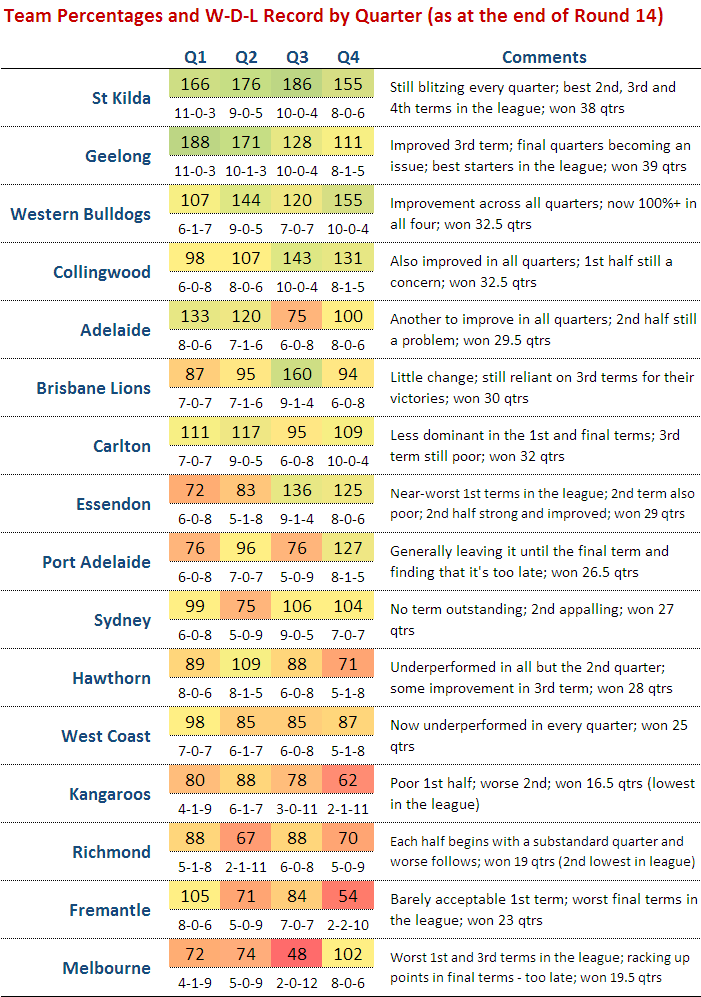
The table below includes each teams' percentage by quarter and its win-draw-lose record by quarter as at the end of the 14th round:


(The comments in the right-hand column in some cases make comparisons to a team's performance after Round 7. This was the subject of an earlier blog.)

Geelong, St Kilda and, to a lesser extent, Adelaide, are the kings/queens of the 1st quarter. The Cats and the Saints have both won 11 of 14 first terms, whereas the Crows, despite recording an impressive 133 percentage, have won just 8 of 14, a record that surprisingly has been matched by the 11th-placed Hawks. The Hawks however, when bad have been very, very bad, and so have a 1st quarter percentage of just 89.

Second quarters have been the province of the ladder's top 3 teams. The Saints have the best percentage (176) but the Cats have the best win-draw-lose record (10-1-3). Carlton, though 7th on the ladder, have the 5th best percentage in 2nd quarters and the equal-2nd best win-draw-lose record.

St Kilda have also dominated in the 3rd quarter racking up a league-best percentage of 186 and a 10-0-4 win-draw-lose record. Geelong and Collingwood have also established 10-0-4 records in this quarter. The Lions, though managing only a 9-1-4 win-draw-lose record, have racked up the second-best percentage in the league for this quarter (160).

Final terms, which have been far less important this year than in seasons past, have been most dominated by St Kilda and the Bulldogs in terms of percentage, and by the Dogs and Carlton in terms of win-draw-lose records.

As you'd expect, the poorer teams have tended to do poorly across all terms, though some better-positioned teams have also had troublesome quarters.

For example, amongst those teams in the ladder's top 8 or thereabouts, the Lions, the Dons and Port have all generally failed to start well, recording sub-90 percentages and 50% or worse win-draw-lose performances.

The Dons and Sydney have both struggled in 2nd terms, winning no more than 5 of them and, in the Dons' case, also drawing one.

Adelaide and Port have found 3rd terms most disagreeable, winning only, respectively, 6 and 5 of them and in so doing producing percentages of around 75.

No top-ranked team has truly flopped in the final term, though the Lions' performance is conspicuous because it has resulted in a sub-100 percentage and a 6-0-8 win-draw-lose record.

Finally, in terms of quarters won, Geelong leads on 39 followed by the Saints on 38. There's then a gap back to the Dogs and the Pies on 32.5, and then Carlton, somewhat surprisingly given its ladder position, on 32. Melbourne have only the 3rd worst performance in terms of total quarters won. They're on 19.5, ahead of Richmond on 19 and the Roos on just 16.5. That means, in an average game, the Roos can be expected to win just 1.2 quarters. Eleven of the 16.5 quarters won have come in the first half of games so, to date anyway, Roos supporters could comfortably leave at the main change without much risk of missing a winning Roos quarter or half.

Sunday, July 5, 2009

More Green Shoots

This weekend we learned a great deal.

We learned - if we didn't already know - that the Saints are genuine contenders for the flag this year and aren't at all intimidated by the Cats' incredible win-loss record since 2007. We learned that it is possible to make money without relying on occasional improbable victories by rank outsiders and that last weekend's profit wasn't merely a statistical anomaly. We learned that the Hawks aren't good enough to go back-to-back and that the Dees aren't yet focussed on priority draft picks. And we learned that dogs of dubious breeding shouldn't be entrusted with large sums of cash.

Still, it was another glorious weekend's wagering. Combined, across this weekend and last, Investors have landed 31 winners from 33 bets, missing only a line bet on the Cats last weekend and a highly speculative head-to-head bet on the Tigers at $3.75 this weekend. Even then, neither of these bets lost by more than 3 goals.

New Heritage has so far this season won 38 from 49 bets and is up about 45%. Prudence has won 35 from 44 bets and is up about 19%. Hope, inactive this week, has won 7 from 16 bets across the season and is up by about 33%. Line Redux has won 20 from 39 bets and is finally back in the black, although only by about 1%. Chi-squared is what could politely be called the 'outlier'. It's won 7 from 14 bets and is down by around 33%, over one-half of that loss attributable to this weekend's (obvious in hindsight) folly.

For most Investors, the weekend's successes added between about 8c and 9c to their share price. The two exceptions were MIN #002, who was betless this weekend and so marked time, and MIN #017, whose Heritage-only portfolio leapt over 27c.

These increases leave most Investors up by between about 12% and 15% on the season, the exceptions yet again being MIN #002, who's up 33%, and MIN #017, who's up nearly 45%.

Here's a chart showing each Investor's triumphal march:


On tipping, this week's best performance was HSH's 7 from 8. Most other top tipsters scored 6 from 8, though BKB managed just 5, dropping it into joint 3rd place with STM II on 78 from 112 (70%). Shadow and Silhouette remain joint leaders, now on 82 from 112 (73%). CTL fills out the top 5 places with 76 from 112 (68%).

Only one tipster, ELO, is now showing a loss on level-stake, home team only wagering, commencing in Round 6. Applying this same wagering strategy to the tips of our top 3 tipsters would have yielded profits of over 11 units, which represents an ROI of over 10%.

Whilst ELO might not be performing well on head-to-head wagering, it continues to excel on line betting, recording 6 from 8 this weekend to move to 65 and 47 for the season and a profit to level-staking of 10.57 units. Chi had a good line-betting week too, picking 7 from 8 this week, but he's still at less than 50% (he's 54 and 58) for the season.

In running down the Dockers in the final term on Sunday night, Carlton became only the 8th team this season to come from behind at three-quarter time to win and the 1st team to do so when trailing by 2 goals or more at the last change.

As I've commented before, this has not been a season for winning after trailing. About 68% of teams who've led at the first change (ignoring games that were tied at this change) have gone on to win. This is about 1% point higher than the all-time average. Teams leading at the half (again ignoring games tied at the half) have won 81% of the time, up 2% points on the all-time average, and teams leading at the final change (ignoring games tied at this point) have won 93% of the time, up a startling 7% points on the all-time average.

This latter statistic is not, as you might suspect, the result of teams tending to lead by more at the final change this season compared to previous seasons. In fact, even teams with quite slender leads have been hanging on to win at historically high rates. For example, teams leading by between 6 and 11 points have won 85% of the time (up 13% points on the all-time average), and those leading by between 12 and 17 points have won 100% of the time (up 18% points on the all-time average).

The only three-quarter time lead range that has proved more vulnerable this season than has been the case historically is a lead of between 1 and 5 points, which has been defended only 55% of the time this season, 3% points under the all-time average.

Thursday, July 2, 2009

AFL Players Don't Shave

In a famous - some might say, infamous - paper by Wolfers he analysed the results of 44,120 NCAA Division I basketball games on which public betting was possible, looking for signs of "point shaving".

Point shaving occurs when a favoured team plays well enough to win, but deliberately not quite well enough to cover the spread. In his first paragraph he states: "Initial evidence suggests that point shaving may be quite widespread". Unsurprisingly, such a conclusion created considerable alarm and led, amongst a slew of furious rebuttals, to a paper by sabermetrician Phil Birnbaum refuting Wolfers' claim. This, in turn, led to a counter-rebuttal by Wolfers.

Wolfers' claim is based on a simple finding: in the games that he looked at, strong favourites - which he defines as those giving more than 12 points start - narrowly fail to cover the spread significantly more often than they narrowly cover the spread. The "significance" of the difference is in a statistical sense and relies on the assumption that the handicap-adjusted victory margin for favourites has a zero mean, normal distribution.

He excludes narrow favourites from his analysis on the basis that, since they give relatively little start, there's too great a risk that an attempt at point-shaving will cascade into a loss not just on handicap but outright. Point-shavers, he contends, are happy to facilitate a loss on handicap but not at the risk of missing out on the competition points altogether and of heightening the levels of suspicion about the outcome generally.

I have collected over three-and-a-half seasons of TAB Sporsbet handicapping data and results, so I thought I'd perform a Wolfers style analysis on it. From the outset I should note that one major drawback of performing this analysis on the AFL is that there are multiple line markets on AFL games and they regularly offer different points start. So, any conclusions we draw will be relevant only in the context of the starts offered by TAB Sportsbet. A "narrow shaving" if you will.

In adapting Wolfers' approach to AFL I have defined a "strong favourite" as a team giving more than 2 goals start though, from a point-shaving perspective, the conclusion is the same if we define it more restrictively. Also, I've defined "narrow victory" with respect to the handicap as one by less than 6 points. With these definitions, the key numbers in the table below are those in the box shaded grey.


These numbers tell us that there have been 27(13+4+10) games in which the favourite has given 12.5 points or more start and has won, by has won narrowly by enough to cover the spread. As well, there have been 24(11+7+6) games in which the favourite has given 12.5 points or more start and has won, but has narrowly not won by enough to cover the spread. In this admittedly small sample of just 51 games, there is then no statistical evidence at all of any point-shaving going on. In truth if there was any such behaviour occurring it would need to be near-endemic to show up in a sample this small lest it be washed out by the underlying variability.

So, no smoking gun there - not even a faint whiff of gunpowder ...

The table does, however, offer one intriguing insight, albeit that it only whispers it.

The final column contains the percentage of the time that favourites have managed to cover the spread for the given range of handicaps. So, for example, favourites giving 6.5 points start have covered the spread 53% of the time. Bear in mind that these percentages should be about 50%, give or take some statistically variability, lest they be financially exploitable.

It's the next percentage down that's the tantalising one. Favourites giving 7.5 to 11.5 points start have, over the period 2006 to Round 13 of 2009, covered the spread only 41% of the time. That percentage is statistically significantly different from 50% at roughly the 5% level (using a two-tailed test in case you were wondering). If this failure to cover continues at this rate into the future, that's a seriously exploitable discrepancy.

To check if what we've found is merely a single-year phenomenon, let's take a look at the year-by-year data. In 2006, 7.5-to 11.5-point favourites covered on only 12 of 35 occasions (34%). In 2007, they covered in 17 of 38 (45%), while in 2008 they covered in 12 of 28 (43%). This year, to date they've covered in 6 of 15 (40%). So there's a thread of consistency there. Worth keeping an eye on, I'd say.

Another striking feature of this final column is how the percentage of time that the favourites cover tends to increase with the size of the start offered and only crosses 50% for the uppermost category, suggesting perhaps a reticence on the part of TAB Sportsbet to offer appropriately large starts for very strong favourites. Note though that the discrepancy for the 24.5 points or more category is not statistically significant.

Wednesday, July 1, 2009

Chi Returns As Hope Fades

Chi, as a dog (which he is, so I guess that's a little redundant, but bear with me) is prone to inexplicable bursts of canine euphoria during which times he's apt to bound around like a dog a fraction of his age.

Whatever it is that transports him into these displays of friskiness clearly struck sometime this week just as he was contemplating his weekly wagers. Why else would he have decided to put 17.7% of the Fund on the Tigers at $3.75? His other wager is a much more sedate one: 4.6% of the Fund on the Pies at $1.55.

Prudence has sipped from the same chalice - dog slobber and all - as evidenced by its two most extreme wagers of 1.9% on St Kilda at $2.35, and 1.5% on the Dees at $2.10. As well as these it has three other wagers on teams at prices ranging from $1.30 to $1.55, the largest on being 4.9% on the Swans at $1.30.

New Heritage has also found a lot to like, with wagers in all but the Richmond v Adelaide game. These wagers include almost 12% of the Fund risked on teams priced above $2: Melbourne (5.4% @ $2.10), Port (3.1% @ $2.35) and St Kilda (3.1% @ $2.35). The four other bets range in size from 11.4% on Sydney @ $1.30 to a neither-here-nor-there 0.1% on Carlton @ $1.55.

Line Redux, the only other active Fund this weekend as we are again Hope-less, has found four wagers, three on teams receiving start and one on the Pies, giving start.

Together these produce a Ready Reckoner that looks a lot like this:


Unusually, due mainly to Chi's Richmond wager, all Investors except MIN #017 have roughly equal upside and downside risk this weekend.

On tipping we have:
* Collingwood the unanimous favourites over the Dons.
* West Coast 9-4 favourites over the Dees. Amongst the top six tipsters, the Dees have Shadow, Silhouette and STM II as supporters and the Eagles have BKB, ELO and CTL. Chi has this as one of his four - yes, four - one point margin predictions and hence Games of the Round.
* Brisbane are 12-1 favourites over Port. Only HSH is tipping Port.
* Adelaide are 12-1 favourites over the Tigers. Chi is the sole Tigers fan (hence the wager) but here too is prediction a single point margin making this another of his Games of the Round.
* The Dogs and unanimous favourites over the Hawks.
* Sydney are 8-5 favourites over the Roos. The top six tipsters are split as for the Eagles v Dees clash. This time Shadow, Silhouette and STM II are siding with the Roos and BKB, ELO and CTL are on the Swans.
* St Kilda are 10-3 favourites over the Cats. Geelong have, amongst the top six tipsters, only BKB and ELO in their corner. Chi and ELO are tipping just one point margins and so have this as a/the Game of the Round.
* Carlton are 11-2 favourites over Freo. Only HSH and EI II have tipped Fremantle. Chi though has this as another one pointer, which makes this his fourth and final Game of the Round.

So close are many of the games expected to be this weekend, anyone who tips the card deserves double points in their tipping competition. One measure of this expected closeness is the average points start per game on line betting.This week that statistic is 14.6 points per game, more than two points lower than the next-lowest this season, which was 16.9 points per game in Round 5.

Another measure is the combined probability of all underdogs winning in the round. The probability of that happening this week is about 3,800 to 1, which is roughly 12 surprisal bits. Previously, the lowest this has been this season was about 7,950 to 1, or approximately 13 surprisal bits, which it was in Round 1. In other words, the probability of all 8 underdogs winning this week is roughly twice what it's been for any other round this season.

For Line Betting:
* Chi's on Collingwood, Melbourne, Port, Richmond, the Dogs, the Roos, the Saints and Fremantle.
* ELO agrees except for swapping West Coast in for Melbourne.