Saturday, February 28, 2009

Teams' All-Time Records

At this time of year, before we fixate on the week-to-week triumphs and travesties of yet another AFL season, it's interesting to look at the varying fortunes of all the teams that have ever competed in the VFL/AFL.

The table below provides the Win, Draw and Loss records of every team.


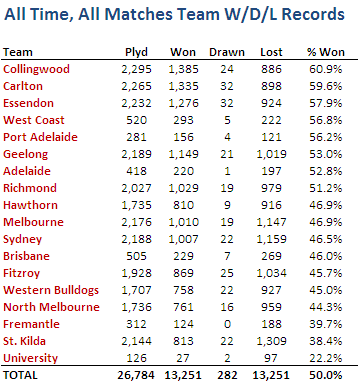
As you can see, Collingwood has the best record of all the teams having won almost 61% of all the games in which it has played, a full 1 percentage point better than Carlton, in second. Collingwood have also played more games than any other team and will be the first team to have played in 2,300 games when Round 5 rolls around this year.

Amongst the relative newcomers to the competition, West Coast and Port Adelaide - and to a lesser extent, Adelaide - have all performed well having won considerably more than half of their matches.

Sticking with newcomers but dipping down to the other end of the table we find Fremantle with a particularly poor record. They've won just under 40% of their games and, remarkably, have yet to register a draw. (Amongst current teams, Essendon have recorded the highest proportion of drawn games at 1.43%, narrowly ahead of Port Adelaide with 1.42%. After Fremantle, the team with the next lowest proportion of drawn games is Adelaide at 0.24%. In all, 1.05% of games have finished with scores tied.)

Lower still we find the Saints, a further 1.3 percentage points behind Fremantle. It took St Kilda 48 games before it registered its first win in the competition, which should surely have been some sort of a hint to fans of the pain that was to follow across two world wars and a depression (maybe two). Amongst those 112 seasons of pain there's been just the sole anaesthetising flag, in 1966.

Here then are a couple of milestones that we might witness this year that will almost certainly go unnoticed elsewhere:
- Collingwood's 2,300th game (and 1,400th win or, if the season's a bad one for them, 900th loss)
- Carlton's 900th loss
- West Coast's 300th win
- Port Adelaide's 300th game
- Geelong's and Sydney's 2,200th game
- Adelaide's 200th loss
- Richmond's 1,000th loss (if they fail to win more than one match all season)
- Fremantle's 200th loss
 
Granted, few of those are truly banner events, but if AFL commentators were as well supported by statisticians as, say, Major League Baseball, you can bet they'd get a mention, much as equally arcane statistics are sprinkled liberally in the 3 hours of dead time there is between pitches.

Wednesday, February 25, 2009

Which Quarter Do Winners Win?

Today we'll revisit yet another chestnut and we'll analyse a completely new statistic.

First, the chestnut: which quarter do winning teams win most often? You might recall that for the previous four seasons the answer has been the 3rd quarter, although it was a very close run thing last season, when the results for the 3rd and 4th quarters were nearly identical.


Monday, February 16, 2009

Is the Competition Getting More Competitive?

We've talked before about the importance of competitiveness in the AFL and the role that this plays in retaining fans' interest because they can legitimately believe that their team might win this weekend (Melbourne supporters aside).

Last year we looked at a relatively complex measure of competitiveness that was based on the notion that competitive balance should produce competition ladders in which the points are spread across teams rather than accruing disproportionately to just a few. Today I want to look at some much simpler diagnostics based on margins of victory.

Thursday, February 12, 2009

Winners' Share of Scoring

You might recall from seasons past my commenting on what I've claimed to be a startling regularity in AFL scoring, specifically, the proportion of scoring shots recorded by winning teams.

In 2008, winning teams racked up 57.3% of all scoring shots, while in 2007 the figure was 56.6%, and in 2006 it was 56.7%. Across the period 1999 to 2008 this percentage bounced around in a range between 56.4% and 57.8%. By any standard that's remarkable regularity.

Monday, February 9, 2009

How Important is Pre-Season Success?

With the pre-season now underway it's only right that I revisit the topic of the extent to which pre-season performance predicts regular season success.

Here's the table with the relevant data:

The macro view tells us that, of the 21 pre-season winners, only 14 of them have gone on to participate in the regular season finals in the same year and, of the 21 pre-season runners-up, only 12 of them have made that same category. When you consider that roughly one-half of the teams have made the regular season finals in each year - slightly less from 1988 to 1993, and slightly more in 1994 - those stats look fairly unimpressive.

But a closer, team-by-team view shows that Carlton alone can be blamed for 3 of the 7 occasions on which the pre-season winner has missed the regular season finals, and Adelaide and Richmond can be blamed for 4 of the 9 occasions on which the pre-season runner-up has missed the regular season finals.


So, unless you're a Crows, Blues or Tigers supporter, you should be at least a smidge joyous if your team makes the pre-season final; if history's any guide, the chances are good that your team will get a ticket to the ball in September.
 
It's one thing to get a ticket but another thing entirely to steal the show. Pre-season finalists can, collectively, lay claim to five flags but, as a closer inspection of the previous table will reveal, four of these flags have come from just two teams, Essendon and Hawthorn. What's more, no flag has come to a pre-season finalist since the Lions managed it in 2001.

On balance then, I reckon I'd rather the team that I supported remembered that there's a "pre" in pre-season.

Sunday, February 8, 2009

Who Fares Best In The Draw?

Well I guess it's about time we had a look at the AFL draw for 2009.

I've summarised it in the following schematic:

The numbers show how many times a particular matchup occurs at home, away or at a neutral venue in terms of the team shown in the leftmost column. So, for example, looking at the first row, Adelaide play the Lions only once during 2009 and it's an away game for Adelaide.

For the purpose of assessing the relative difficulty of each team's schedule, I'll use the final MARS Ratings for 2008, which were as follows:

Given those, the table below shows the average MARS Rating of the opponents that each team faces at home, away and at neutral venues.

So, based solely on average opponent rating, regardless of venue, the Crows have the worst of the 2009 draw. The teams they play only once include five of the bottom six MARS-ranked teams in Brisbane (11th), Richmond (12th), Essendon (14th), West Coast (15th), Melbourne (16th). One mitigating factor for the Crows is that they tend to play stronger teams at home: they have the 2nd toughest home schedule and only the 6th toughest away and neutral-venue schedules.

Melbourne fare next worst in the draw, meeting just once four of the bottom five teams, excluding themselves. They too, however, tend to face stronger teams at home and relatively weaker teams away, though their neutral-venue schedule is also quite tough (St Kilda and Sydney).

Richmond, in contrast, get the best of the draw, avoiding a second contest with six of the top eight teams and playing each of the bottom four teams twice.

St Kilda's draw is the next best and sees them play once only four of the teams in the top eight and play each of the bottom three teams twice.

Looking a little more closely and differentiating home games from away games, we find that the Bulldogs have the toughest home schedule but also the easiest away schedule. Port Adelaide have the easiest home schedule and Sydney have the toughest away schedule.

Generally speaking, last year's finalists have fared well in the draw, with five of them having schedules ranked 10th or lower. Adelaide, Sydney and, to a lesser extent, the Bulldogs are the exceptions. It should be noted that higher-ranked teams always have a relative advantage over other teams in that their schedules exclude games against themselves. 

Friday, February 6, 2009

A Little AFL/VFL History

Every so often this year I'll be diving into the history of the VFL/AFL to come up with obscure and conversation-stopping facts for you to use at the next social event you attend.

For example, do you know the most common score in AFL history? It's 12.12 (84) and has been a team's final score about 0.88% of the time (counting two scores for each game in the denominator for that percentage). What if we restrict our attention to more recent seasons, say 1980 to 2008? It's 12.12 again (84), only now its prevalence is 0.98%. Last year though we managed only a single 12.12 (84) score, courtesy of St Kilda in Round 14.