
Tuesday, August 31, 2010
Season 2010: An Assessment of Competitiveness
For many, the allure of sport lies in its uncertainty. It's this instinct, surely, that motivated the creation of the annual player drafts and salary caps - the desire to ensure that teams don't become unbeatable, that "either team can win on the day".
Monday, August 30, 2010
A Competition of Two Halves
In the previous blog I suggested that, based on winning percentages when facing finalists, the top 8 teams (well, actually the top 7) were of a different class to the other teams in the competition.
The Eight We Had To Have?
This blog addresses a single topic: amongst the eight teams that won't be taking part in the weekend's festivities, are there any that can legitimately claim that they should be?
Sunday, August 29, 2010
Simulating the Finals (After Round 22)
I've just run a quick 1 million simulations of the finals using the following probability matrix, which is based on each team's current MARS Rating and assumes that there is no home ground advantage in the finals:
MAFL 2010 : Round 22 Results
*Sigh*
Entering into Sunday with wagers on both favourites and a cumulative 3.7% profit on the weekend so far for the Recommended Portfolio, I had what I thought were reasonable hopes that this Portfolio would end the weekend having erased some of the loss it had accumulated over the preceding 6 months.
Finalist v Finalist: Who Has the Best Record in 2010?
Twenty-three weeks of footy is over and the AFL's binary division has begun, with the sixteen teams now cleaved in two.
Let's take a look at how the finalists have performed when they've met one of their own.
Let's take a look at how the finalists have performed when they've met one of their own.
Thursday, August 26, 2010
MAFL 2010 : Round 22
So we've reached the end of the home-and-away season with much still to do if Investors are to finish the season showing a nett gain. A perfect set of results this weekend would drag the Recommended Portfolio narrowly into profit, but similar good fortune would not be enough to do the same for MIN#002 or MIN#017; they'll also need favourable results throughout the final series to finish ahead.
Wednesday, August 25, 2010
Who Left the Dogs Out?
Freo's selectorial shenanigans of last weekend appear to have spooked the TAB Sportsbet bookie, so much so that he's not yet posted any of the line markets.
I expect he'll address this oversight sometime in the next 24 hours, in which case I'll post the week's wagering and tipping details tomorrow night.
In the meantime, here's a follow up blog on simulating the finals.
I expect he'll address this oversight sometime in the next 24 hours, in which case I'll post the week's wagering and tipping details tomorrow night.
In the meantime, here's a follow up blog on simulating the finals.
Sunday, August 22, 2010
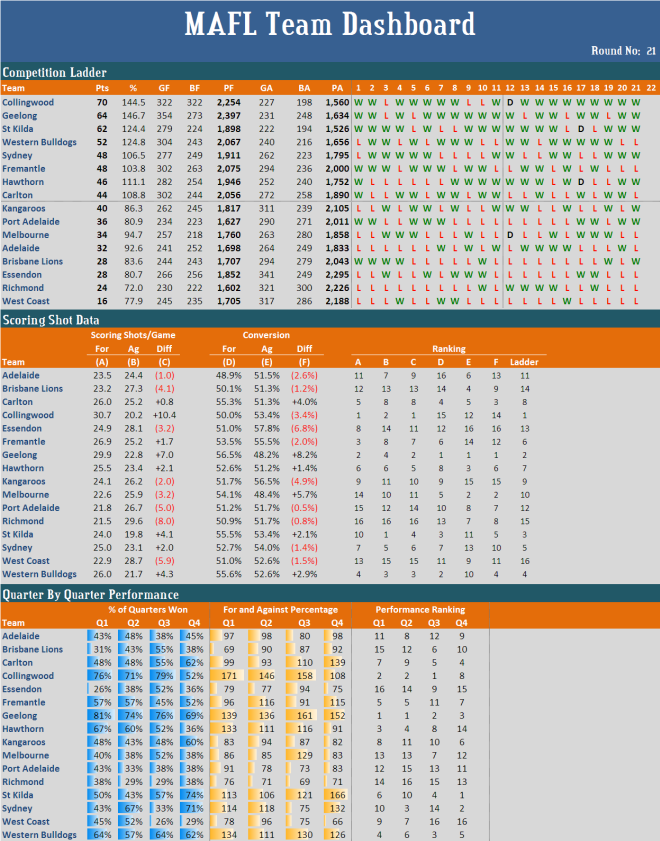
Final Ladder Positions and Team's Flag Prospects After Round 21
The teams that will comprise the final 8 are now determined - barring Lazarian performances - but their final order is not.
MAFL 2010 : Round 21 Results
Teams, I suppose, finish last for a reason.
And so it was with the Eagles on Sunday afternoon, who appeared to be oblivious to the importance that most MAFL Investors were placing on the outcome of their clash with the Roos. Going into that game, Investors with the Recommended Portfolio were up by about 1.3% on the round and only needed a win by the Eagles - or, worst case, a loss by 6 points or fewer - to finish the weekend in the black.
Why Sydney Won't Finish Fourth
As the ladder now stands, Sydney trail the Dogs by 4 competition points but they have a significantly inferior percentage. The Dogs have scored 2,067 points and conceded 1,656, giving them a percentage of 124.8, while Sydney have scored 1,911 points and conceded 1,795, giving them a percentage of 106.5, some 18.3 percentage points lower.
Wednesday, August 18, 2010
MAFL 2010 : Round 21
The AFL contend that the Cats are taking on the Blues at home this Friday night. I contend that it's the Blues that are taking on the Cats at home.
When I made the decision to deem this game a Blues home game over 6 months ago, I had no idea quite how important it might prove to be for MAFL Investors. As a direct consequence of that decision, all but the New Heritage Fund were permitted only to wager on the Blues, and forbidden to wager on the Cats. Four of the Funds have taken this opportunity, which means that many Investors now own a large, egg-laden basket named "Carlton".
Tuesday, August 17, 2010
Julia +10.5 Seats
Julia Gillard's in an unusual position this weekend. She can take either side of a wager and probably be happy whether it wins or it loses.
Monday, August 16, 2010
Letting the Computer Do (Most of) the Work
Around this time of year it's traditional to work through the remaining matches for each team and attempt to codify what each needs to do in order to secure a particular finish - minor premiership, top 4, top 8 or Spoon.
Sunday, August 15, 2010
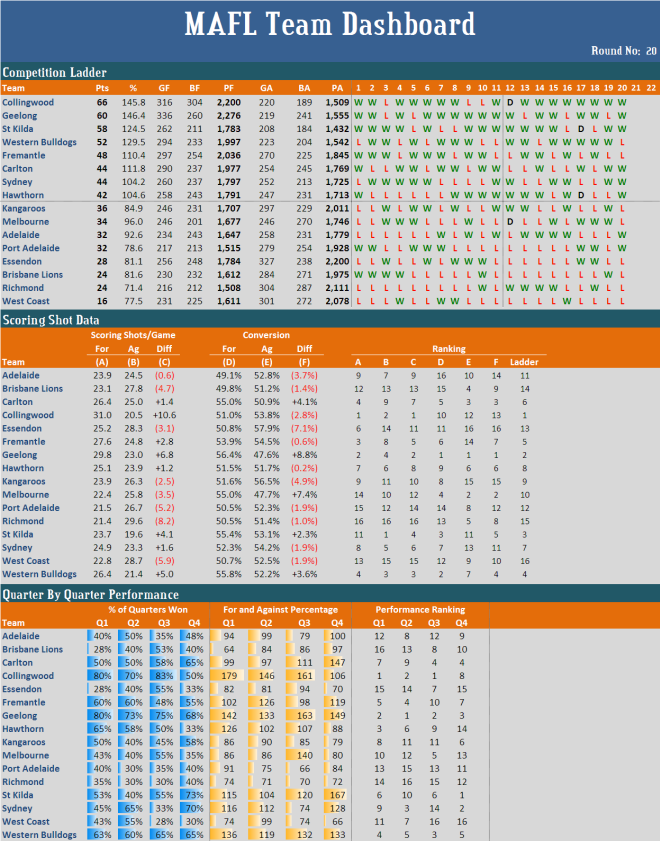
Final Ladder Positions: Simulations After Round 20
As I type this late on Sunday evening all ladder-related markets are suspended on TAB Sportsbet, so I'll necessarily be excluding any discussion of value bets in these markets. I'll post subsequently on this once the markets are up.
In the meantime, here's what my simulations now make of each team's chances.
MAFL 2010 : Round 20 Results
Meh.
It's weekends like this one that make me remember a conversation that took place between two of my then team-members outside my office one morning some years ago when things were busy and nerves were generally a little frayed.
Wednesday, August 11, 2010
MAFL 2010 : Round 20
How nice it is to be at this late stage of the season and still have six of the eight games with some effect on the composition of the final 8.
The Port v West Coast and Brisbane v Adelaide matchups are the two exceptions - though mathematically even Port and Adelaide still have the faintest glimmer of a sliver of hope (if you believe the results of my simulations in an earlier blog, which estimated them both as about 1,000/1 chances to snatch 8th).
Sometimes the Hare Wins
Leading early has never been as predictive of the final outcome as it has been this season.
Consider the statistics. In the 150 games that have produced a clear winner, that winner has led 75% of the time at the 1st change, 76% of the time at the main break, and a startling 89% of the time at the final change. Put another way, only 16 teams have trailed at the final change - by any amount - and gone on to win.
Tuesday, August 10, 2010

Playing the Percentages
It seems very likely that this season, some ladder positions will be decided on percentage, so I thought it might be helpful to give you an heuristic for estimating the effect of a game result on a team's percentage.
Sunday, August 8, 2010
Final Ladder Positions: Simulations After Round 19
Two of the markets for final ladder positions are no longer being offered by TAB Sportsbet. Collingwood's victory over the Cats has, it seems, all but determined the destination of the minor premiership, and the Lions' last-gasp win over the Eagles has done something similar for the Spoon.
MAFL 2010 : Round 19 Results
The only conclusion that a reasonable person could reach is that the Recommended Portfolio, concerned about causing undue alarm, has determined the best way to prepare the TAB Sportsbet bookie for its eventual profitability is to do so very, very slowly.
Wednesday, August 4, 2010
MAFL 2010 : Round 19
It's a strange round indeed - and a pivotal one - that footy fans can look forward to this weekend.
Strange because of the number of games where the outcome appears to be a near coin-toss - a point that we'll come back to a little later in this blog - but not at all strange in terms of the activity level of the MAFL Funds.
Monday, August 2, 2010
Thank the Crows and Blame the Saints
Which teams do you think have generated the most profit for each Fund, and which have inflicted the greatest losses?
When I've looked at this question in the past I've tended to take the most obvious approach to the analysis whereby I've calculated for each team the Return on Net Funds that has resulted from wagers on that. In short, what I've done is to determine how many cents each team has added to or subtracted from the value of a particular Fund as a result of the wagering returns it has directly provided.
Final Ladder Positions: Simulations After Round 18
The weekend results for St Kilda, Fremantle, Melbourne, Richmond and West Coast were the ones that most reshaped the various ladder position markets.
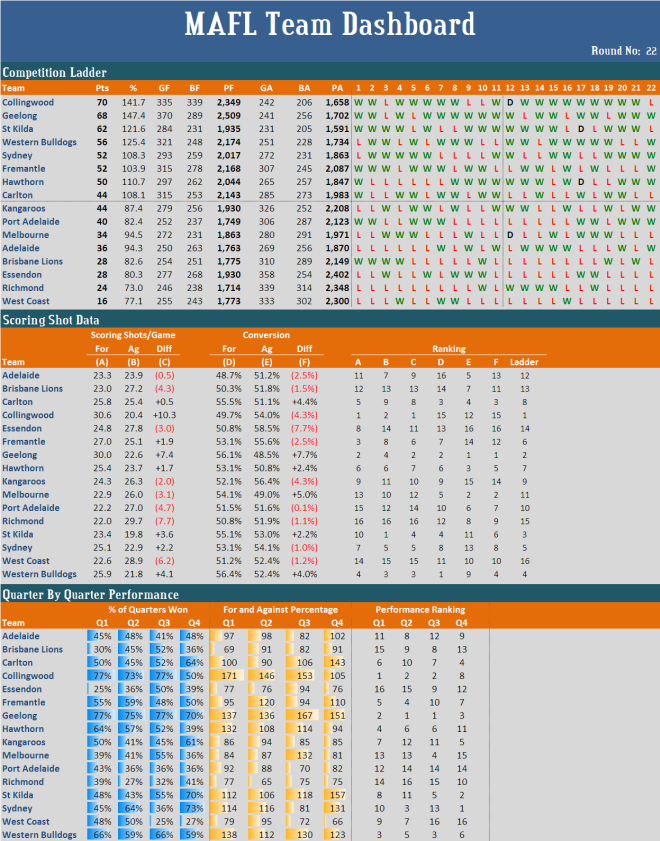
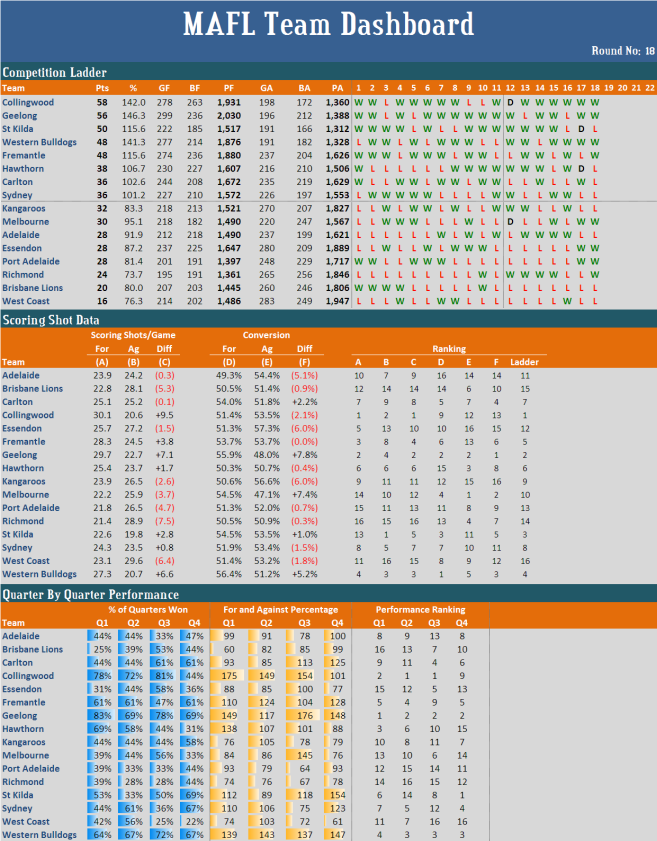
MAFL 2010 : Team Dashboard for Round 18
The MAFL Team Dashboard for Round 18 is below.
Here are a few statistical highlights for each team chosen because the statistic illuminates sustained performance is at the extremes or anomalous performance relative to a team's ladder position:
Collingwood
Here are a few statistical highlights for each team chosen because the statistic illuminates sustained performance is at the extremes or anomalous performance relative to a team's ladder position:
Collingwood
- Kicked 2nd most goals (278)
- Kicked most behinds (263)
- Have the 2nd best percentage (142.0)
- Ranked 12th on opponent conversion rate (53.5%)
- Ranked 9th on Q4 performances (44% of quarters won, 101 percentage)
- Kicked most goals (299) and most total points (2,030)
- Only team to have kicked 2,000 points in the season
- Have the best percentage (146.3)
- Ranked 1st or 2nd for performances in every match quarter
- Kicked fewest goals of any team in the top 8 (222)
- Conceded fewest goals of any team in the competition (191, level with the Dogs) and fewest total points (1,312)
- Ranked 13th on scoring shots per game (22.6) but 1st on opponent scoring shots per game (19.8)
- Ranked 14th on Q2 performances (33% of quarters won, 89 percentage) and 1st on Q4 performances (69% of quarters won, 154 percentage)
- Conceded fewest goals of any team (191, level with the Saints) and 2nd fewest total points (1,328)
- Ranked 1st on conversion rate (56.4%)
- Ranked 1st on 'team most difficult to comment about' metric (aeq with the Roos - 2 comments ... well, now 3)
- Conceded the most goals of any team in the top 8 (237)
- Ranked 3rd on scoring shots per game (28.3)
- Ranked 13th on opponent conversion rate (53.7%)
- Ranked 9th on Q3 performances (47% of quarters won, 104 percentage)
- Kicked only 3 more goals than behinds (230 vs 227)
- Ranked 15th on conversion rate (50.3%) but 3rd on opponent conversion rate (50.7%)
- Ranking of match quarter performances declines from earlier to later quarters: ranked 3rd for Q1 performances and 15th for Q4 performances
- Conceded most behinds of any team in the top 8 (219) and 2nd most goals (235)
- Worst record for 2nd half of season of any team in the top 8 (2-5)
- Have a better than 100 percentage for Q3 and Q4 and a worse than 100 percentage for Q1 and Q2
- Worst percentage of any team in the top 8 (101.2)
- Ranked 5th on opponent scoring shots per game (23.5)
- Ranked 12th on Q3 performances (36% of quarters won, 75 percentage) and 4th on Q4 performances (67% of quarters won, 123 percentage)
- Worst percentage of any team in the top 12 (83.3)
- Ranked 15th on opponent conversion rate (56.6%)
- Ranked 1st on 'team most difficult to comment about' metric (aeq with the Dogs)
- Conceded most behinds of any team in the top 13 (247)
- Better record for 2nd half of season than the three teams above them on the ladder
- Ranked 1st on opponent conversion rate (47.1%) and 4th on own conversion rate (54.5%)
- Ranked 14th on scoring shots per game (22.2)
- Ranked 6th on Q3 performances (56% of quarters won, 145 percentage)
- Better record for 2nd half of season than the four teams above them on the ladder
- Worst conversion rate of any team (49.3%)
- Ranked 13th on Q3 performances
- Have lost more than they've won of every match quarter
- Kicked the most goals of any team not in the top 8 (237), the most behinds (225) and the most points (1,647)
- Conceded the most goals of any team (280) and the most points (1,889)
- Ranked 5th on scoring shots per game (25.7)
- Ranked last on opponent conversion rate (57.3%)
- Ranked 5th on Q3 performances (58% of quarters won, 100 percentage)
- Kicked the 2nd fewest number of goals of any team (201) and the 2nd fewest total points (1,397)
- Ranked 15th on scoring shots per game (22.2)
- Ranked 15th on Q2 performances (33% of quarters won, 79 percentage)
- Kicked the fewest goals of any team (195) and the fewest total points (1,361)
- Have the worst percentage of any team (73.7)
- Better record for 2nd half of season than the nine teams above them on the ladder
- Ranked 4th on opponent conversion rate (50.9%)
- Ranked last on scoring shots per game (21.4) and 2nd last on opponent scoring shots per game (28.9)
- Ranked 16th on Q2 performances (28% of quarters won, 76 percentage) and 15th on Q3 performances (28% of quarters won, 67 percentage)
- Only team not to have recorded a win in the 2nd half of the season
- Ranked 6th on opponent conversion rate (51.4%)
- Have the worst Q1 performance of any team (25% of quarters won, 60 percentage)
- Kicked within 5 goals of the 7 teams above them on the ladder excluding Essendon
- Conceded the most goals of any team (283) and the most points (1,947)
- Ranked 8th on conversion rate (51.4%) and 9th on opponent conversion rate (53.2%)
- Ranked 7th on Q2 performances (56% of quarters won, 103 percentage), but last on Q3 performances (25% of quarters won, 72 percentage) and Q4 performances (22% of quarters won, 61 percentage)
Sunday, August 1, 2010
MAFL 2010 : Round 18 Results
Every Fund returned a profit on the weekend's wagering, leaving the Recommended Portfolio closer to profitability at the end of the round than it's been since it slipped carelessly into unprofitability in Round 8, and inching the portfolios of MIN#002 and MIN#017 just a little closer to daylight too.
Subscribe to:
Posts (Atom)