
Last blog I promised that I'd take another look at teams' year-to-year changes in ladder position, this time taking a longer historical perspective.
For this purpose I've elected to use the period 1925 to 2008 as there have always been at least 10 teams in the competition from that point onwards. Once again in this analysis I've used each team's final ladder position, not their ladder position as at the end of the home and away season. Where a team has left or joined the competition in a particular season, I've omitted its result for the season in which it came (since there's no previous season) or went (since there's no next season).
As the number of teams making the finals has varied across the period we're considering, I'll not be drawing any conclusions about the rates of teams making or missing the finals. I will, however, be commenting on Grand Final participation as each season since 1925 has culminated in such an event.
Here's the raw data:
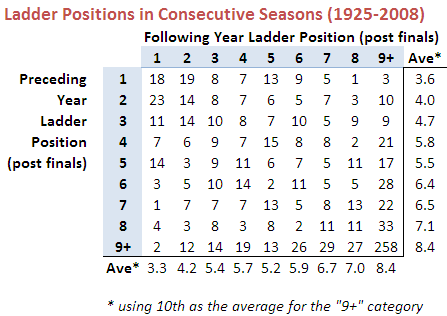
(Note that I've grouped all ladder positions of 9th or lower in the "9+" category. In some years this incorporates just two ladder positions, in others as many as eight.)
A few things are of note in this table:
* Losing Grand Finalists are more likely than winning Grand Finalists to win in the next season.
* Only 10 of 83 winning Grand Finalists finished 6th or lower in the previous season.
* Only 9 of 83 winning Grand Finalists have finished 7th or lower in the subsequent season.
* The average ladder position of a team next season is highly correlated with its position in the previous season. One notable exception to this tendency is for teams finishing 4th. Over one quarter of such teams have finished 9th or worse in the subsequent season, which drags their average ladder position in the subsequent year to 5.8, below that of teams finishing 5th.
* Only 2 teams have come from 9th or worse to win the subsequent flag - Adelaide, who won in 1997 after finishing 12th in 1996; and Geelong, who won in 2007 after finishing 10th in 2006.
* Teams that finish 5th have a 14-3 record in Grand Finals that they've made in the following season. In percentage terms this is the best record for any ladder position.
Here's the same data converted into row percentages.
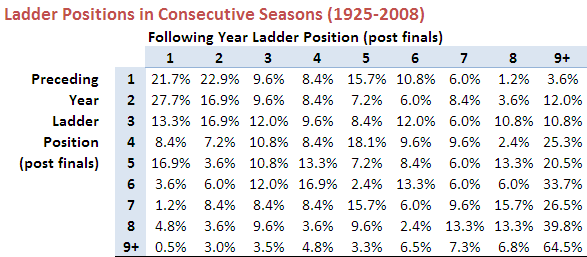
Looking at the data in this way makes a few other features a little more prominent:
* Winning Grand Finalists have about a 45% probability of making the Grand Final in the subsequent season and a little under a 50% chance of winning it if they do.
* Losing Grand Finalists also have about a 45% probability of making the Grand Final in the subsequent season, but they have a better than 60% record of winning when they do.
* Teams that finish 3rd have about a 30% chance of making the Grand Final in the subsequent year. They're most likely to be losing Grand Finalists in the next season.
* Teams that finish 4th have about a 16% chance of making the Grand Final in the subsequent year. They're most likely to finish 5th or below 8th. Only about 1 in 4 improve their ladder position in the ensuing season.
* Teams that finish 5th have about a 20% chance of making the Grand Final in the subsequent year. These teams tend to the extremes: about 1 in 6 win the flag and 1 in 5 drops to 9th or worse. Overall, there's a slight tendency for these teams to drop down the ladder.
* Teams that finish 6th or 7th have about a 20% chance of making the Grand Final in the subsequent year. Teams finishing 6th tend to drop down the ladder in the next season; teams finishing 7th tend to climb.
* Teams that finish 8th have about a 8.5% chance of making the Grand Final in the subsequent year. These teams tend to climb in the ensuing season.
* Teams that finish 9th or worse have about a 3.5% chance of making the Grand Final in the subsequent year. They also have a roughly 2 in 3 chance of finishing 9th or worse again.
So, I suppose, relatively good news for Cats fans and perhaps surprisingly bad news for St Kilda fans. Still, they're only statistics.
No comments:
Post a Comment