Today we'll revisit yet another chestnut and we'll analyse a completely new statistic.
First, the chestnut: which quarter do winning teams win most often? You might recall that for the previous four seasons the answer has been the 3rd quarter, although it was a very close run thing last season, when the results for the 3rd and 4th quarters were nearly identical.
How then does the picture look if we go back across the entire history of the VFL/AFL?

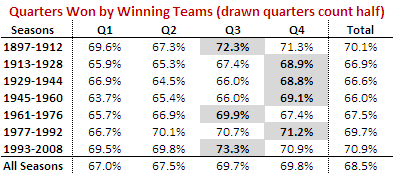
It turns out that the most recent epoch, spanning the seasons 1993 to 2008, has been one in which winning teams have tended to win more 3rd quarters than any other quarter. In fact, it was the quarter won most often in nine of those 16 seasons.
This, however, has not at all been the norm. In four of the other six epochs it has been the 4th quarter that winning teams have tended to win most often. In the other three epochs the 4th quarter has been the second most commonly won quarter.
But, the 3rd quarter has rarely been far behind the 4th, and its resurgence in the most recent epoch has left it narrowly in second place in the all-time statistics.
A couple of other points are worth making about the table above. Firstly, it's interesting to note how significantly more frequently winning teams are winning the 1st quarter than they have tended to in epochs past. Successful teams nowadays must perform from the first bounce.
Secondly, there's a clear trend over the past 4 epochs for winning teams to win a larger proportion of all quarters, from about 66% in the 1945 to 1960 epoch to almost 71% in the 1993 to 2008 epoch.
Now on to something a little different. While I was conducted the previous analysis, I got to wondering if there'd ever been a team that had won a match in which in had scored more points than its opponent in just a solitary quarter. Incredibly, I found that it's a far more common occurrence than I'd have estimated.

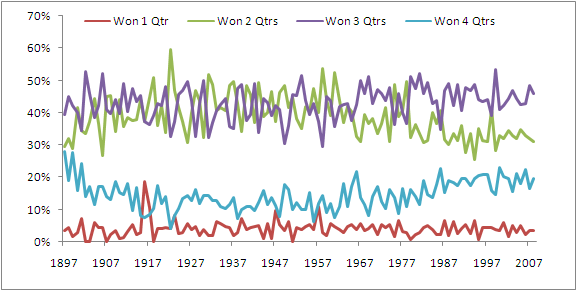
The red line shows, for every season, the percentage of games in which the winner won just a solitary quarter (they might or might not have drawn any of the others). The average percentage across all 112 seasons is 3.8%. There were five such games last season, in four of which the winner didn't even manage to draw any of the other three quarters. One of these games was the Round 19 clash between Sydney and Fremantle in which Sydney lost the 1st, 2nd and 4th quarters but still got home by 2 points on the strength of a 6.2 to 2.5 3rd term.
You can also see from the chart the upward trend since about the mid 1930s in the percentage of games in which the winner wins all four quarters, which is consistent with the general rise, albeit much less steadily, in average victory margins over that same period that we saw in an earlier blog.
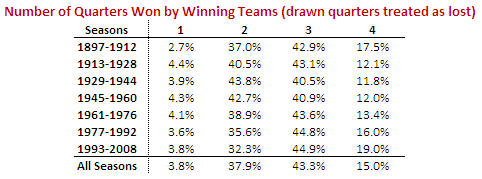
To finish, here's the same data from the chart above summarised by epoch:


No comments:
Post a Comment